Complete Health Indicator Report of Adverse Childhood Experiences (ACEs)
Definition
Adverse Childhood Experiences, or ACEs, are potentially traumatic events that occur in childhood (0-17 years) such as experiencing violence, abuse, or neglect; witnessing violence in the home; and having a family member attempt or die by suicide. Also included are aspects of the child's environment that can undermine their sense of safety, stability, and bonding such as growing up in a household with substance misuse, mental health problems, or instability due to parental separation or incarceration of a parent, sibling or other member of the household.Numerator
The BRFSS respondents who responded affirmatively to the eleven questions in the Adverse Childhood Experience (ACE) Module.Denominator
The number of adults aged 18 and above who participated in the BRFSS.Data Interpretation Issues
The Adverse Childhood Experiences (ACEs) Module was included in the Utah BRFSS in 2013, 2016, 2018, 2020, and 2022. '''ACEs Module Questions:'''[[br]] Looking back before you were 18 years of age--- # Did you live with anyone who was depressed, mentally ill, or suicidal? # Did you live with anyone who was a problem drinker or alcoholic? # Did you live with anyone who used illegal street drugs or who abused prescription medications? # Did you live with anyone who served time or was sentenced to serve time in a prison, jail, or other correctional facility? # Were your parents separated or divorced? # How often did your parents or adults in your home ever slap, hit, kick, punch or beat each other up? # Before age 18, how often did a parent or adult in your home ever hit, beat, kick, or physically hurt you in any way? Do not include spanking. # How often did a parent or adult in your home ever swear at you, insult you, or put you down? # How often did anyone at least 5 years older than you or an adult, ever touch you sexually? # How often did anyone at least 5 years older than you or an adult, try to make you touch sexually? # How often did anyone at least 5 years older than you or an adult, force you to have sex?[[br]] [[br]] In the 2022 survey, the three sexual abuse questions were combined into one, How often did anyone at least 5 years older than you or an adult, ever touch you sexually, OR ever try to make you touch them sexually, OR force you to have sex? '''Module Weaknesses:''' * Limited to specific more common adversities * Severity or frequency of potential trauma is unknown * All experiences are weighted equally * Module does not account for protective factors in the past that might prevent or mitigate the negative long-term impacts of childhood adversities.Why Is This Important?
Childhood experiences, both positive and negative, have a tremendous impact on future violence victimization and perpetration, and lifelong health and opportunity. Exposure to ACEs may result in toxic stress responses that can impede a child's development, such as changes in gene expression, changes in brain connectivity and immune function, and changes in the type of coping strategies adopted. While many coping strategies are healthy and help reduce acute stress, some (e.g. smoking cigarettes, drinking alcohol, using substances, engaging in risky sexual behavior) present additional risks to health and wellbeing. As such, exposure to early adversity can increase the risk of later chronic and infectious health conditions through changes in physiological mechanisms, as well as increased engagement in health risk behaviors, and can ultimately result in premature death. ACEs are common; as nearly two-thirds (63.9%) of surveyed U.S. adults experienced at least one ACE and many adults experienced more than one. Some populations are more vulnerable, however, to experiencing ACEs, such as children living in poverty and racial and ethnic minorities, because of the structural and social conditions in which some children and families live, learn, work, and play. It is important to remember that ACEs are preventable, and when present their effects can be mitigated with the help of healthy relationships.How Do We Compare With the U.S.?
When comparing BRFSS data, the prevalence of 4+ ACEs in Utah is higher than nationally (18.8% vs 17.3%). National prevalence comes from a 2023 Swedo EA, Aslam MV, Dahlberg LL, et al. study that included 2011-2020 BRFSS data from 25 states, while Utah prevalence is from the ACEs Module included in the Utah BRFSS in 2018, 2020, and 2022. Source: Swedo EA, Aslam MV, Dahlberg LL, et al. Prevalence of Adverse Childhood Experiences Among U.S. Adults---Behavioral Risk Factor Surveillance System, 2011-2020. MMWR Morb Mortal Wkly Rep 2023;72:707-715. DOI: [http://dx.doi.org/10.15585/mmwr.mm7226a2].Evidence-based Practices
Promote safe stable nurturing relationships and environments for all children by: # Strengthening Economic Support for Families # Promoting Social Norms that Protect Against Violence and Adversity # Ensuring a Strong Start for Children # Teaching Skills # Connecting Youth to Caring Adults and Activities, and # Intervening to Lessen Immediate and Long-term Harms.[[br]] [[br]] See the CDC's Adverse Childhood Experiences Prevention Resource for Action report,[[br]] [https://www.cdc.gov/violenceprevention/pdf/ACEs-Prevention-Resource_508.pdf].Available Services
The Violence and Injury Prevention Program housed in the Utah Department of Health and Human Services in coordination with the Utah Coalition for Protecting Childhood (UCPC) has developed a State Action Plan for the Primary Prevention of Child Maltreatment in Utah utilizing the CDC's Essentials for Childhood framework. This plan includes specific strategies and approaches to preventing ACEs and mitigating their negative effects by creating safe, stable, and nurturing relationships and environments for all Utah children. The state plan can be found at [https://vipp.utah.gov/essentials-for-childhood/ucpc/]. This is a sensitive topic. If you need information or help finding support for your own experiences of childhood adversity please call 1-800-422-4453.Related Indicators
Relevant Population Characteristics
As the number of ACEs increases so does the risk of injury, sexually transmitted infections (including HIV), mental health problems, maternal and child health problems, teen pregnancy, involvement in sex trafficking, a wide range of chronic diseases, and dying from one of the leading causes of death (such as cancer, diabetes, heart disease, and suicide). ACEs can also negatively impact education, employment, and earnings potential. However, it is important to remember that the presence of ACEs does not mean a child will experience poor outcomes. The presence of positive childhood experiences and protective factors like healthy connections can prevent and mitigate the negative effects of childhood adversity.Related Relevant Population Characteristics Indicators:
- Adolescent Births
- Alcohol Consumption - Binge Drinking
- Alcohol Consumption - Heavy Drinking
- Child Care Numbers of Facilities
- Utah Population Characteristics: Poverty, Children Age 17 and Under
- Community Design: Access to Parks and Elementary Schools
- Community Design: Commute Time
- Community Design: Proximity of Population and Schools to Highways
- Community Design: Types of Transportation to Work
- Cost as a Barrier to Health Care
- Depression: Adult Prevalence
- Domestic Violence During the Perinatal Time Period
- Utah Population Characteristics: Education Level in the Population
- Family Meals
- Fair/poor Health
- Utah Population Characteristics: Household Income
- Utah Population Characteristics: Household Structure
- Utah Health Improvement Index (HII)
- No Health Insurance Coverage
- Health Status: Mental Health Past 30 Days
- Health Status: Physical Health Past 30 Days
- Homicide
- Infant Mortality
- Low Birth Weight
- Life Expectancy at Birth
- Marriage and Divorce
- Maternal Mortality
- Uninsured Children
- Utah Population Characteristics: Income per Capita
- Drug Overdose and Poisoning Incidents
- Utah Population Characteristics: Poverty, All Persons
- Personal Doctor or Health Care Provider
- Sexual Violence
- Substance Abuse (Alcohol or Marijuana) - Adolescents
- Suicide
- Births from unintended pregnancies
Related Health Care System Factors Indicators:
Related Risk Factors Indicators:
- Adolescent Births
- Child Care Numbers of Facilities
- Child emotional abuse, self-reported
- Child physical abuse, self-reported
- Child sexual abuse, self-reported
- Community Design: Access to Parks and Elementary Schools
- Community Design: Commute Time
- Community Design: Proximity of Population and Schools to Highways
- Community Design: Types of Transportation to Work
- Cost as a Barrier to Health Care
- Depression: Adult Prevalence
- Healthcare discrimination
- Domestic Violence During the Perinatal Time Period
- Utah Population Characteristics: Education Level in the Population
- Family Meals
- Fair/poor Health
- Utah Population Characteristics: Household Income
- Utah Population Characteristics: Household Structure
- Utah Health Improvement Index (HII)
- No Health Insurance Coverage
- Health Status: Mental Health Past 30 Days
- Health Status: Physical Health Past 30 Days
- Marriage and Divorce
- Uninsured Children
- Utah Population Characteristics: Income per Capita
- Utah Population Characteristics: Poverty, All Persons
- Postpartum depression
- Sexual Violence
- Sex Ratio at Birth
- Substance Abuse (Alcohol or Marijuana) - Adolescents
- Births from unintended pregnancies
Related Health Status Outcomes Indicators:
- Alcohol Consumption - Binge Drinking
- Alcohol Consumption - Heavy Drinking
- Bladder Cancer
- Blood Cholesterol: Doctor-diagnosed High Cholesterol
- Cancer of the Brain and Central Nervous System
- Breast Cancer Deaths
- Breast cancer incidence
- Cervical Cancer Death
- Cervical cancer incidence
- Child injury deaths
- Child emotional abuse, self-reported
- Child physical abuse, self-reported
- Child sexual abuse, self-reported
- Chlamydia cases
- Smoking Among Adults
- Smoking Among Adolescents
- Colorectal Cancer Deaths
- Colorectal cancer incidence
- Depression: Adult Prevalence
- Deaths due to diabetes as underlying cause
- Diabetes Prevalence
- Disability Prevalence
- Deaths From All Causes
- Fall Injury (Unintentional)
- Fair/poor Health
- Gonorrhea Cases
- Heart Attack: Hospitalizations
- Hepatitis A infections
- Homicide
- Ischemic Heart Disease Deaths
- Blood Pressure: Doctor-diagnosed Hypertension
- Life Expectancy at Birth
- Lung cancer incidence
- Lung Cancer Deaths
- Non-Hodgkin Lymphoma
- Overweight or Obese
- Parkinson's Disease
- Drug Overdose and Poisoning Incidents
- Prediabetes
- Prostate Cancer Deaths
- Prostate cancer incidence
- Sexual Violence
- Stroke (Cerebrovascular Disease) Deaths
- Student Injuries
- Substance Abuse (Alcohol or Marijuana) - Adolescents
- Suicide
- Syphilis Cases - Primary and Secondary
- Traumatic Brain Injury (TBI)
- Tuberculosis (TB) Cases
- Unintentional Injury Deaths
Graphical Data Views
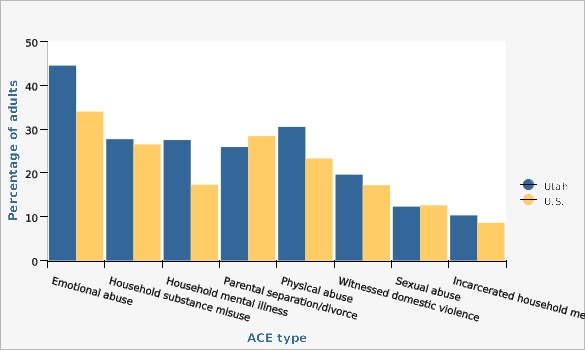
The most common ACE experienced by adults in Utah in 2022 was emotional abuse with 44.5% indicating a parent or adult in the home had sworn at them, insulted them, or put them down before the age of 18. The next most prevalent ACEs in Utah were physical abuse, household substance abuse, and household mental illness (30.5%, 27.7%, and 27.5%).
Compared to national data using the most recent BRFSS data from 25 states (2011-2020), Utahns had a higher prevalence of emotional abuse (44.5% vs 34.0% nationally), household mental illness (27.5% vs 17.3% nationally), physical abuse (30.5% vs 23.3% nationally), domestic violence (19.6% vs 17.2% nationally), and incarcerated household member (10.3% vs 8.6% nationally). Nationally, there was a higher prevalence of parental separation/divorce (28.4% vs 25.9% in Utah). The prevalences were about the same for sexual abuse (12.6% nationally vs 12.3% in Utah) and household substance abuse (26.5% nationally vs 27.7% in Utah).
*Note this figure uses just the most recent year of Utah BRFSS data (2022) to reflect the national study design. Utah data, however, has changed significantly for all of the captured ACEs since the first year this data was collected in 2013. It is supposed that the same changes in openness to reporting childhood adversity would have happened nationally, so comparing data from different years across the country might not be the best approach.
For better comparison with the other figures in this indicators report using the last three years of Utah data (2018, 2020, and 2022), Utah BRFSS respondents indicated the following prevalence of each of the different ACEs: 41.5% experienced emotional abuse, 25.3% experienced household substance misuse, 26.3% experienced household mental illness, 24.1% experienced parental separation/divorce, 25.4% experienced physical abuse, 17.6% witnessed domestic violence, 14.3% experienced sexual abuse, and 9.2% experienced an incarcerated household member.
| Utah vs. U.S. | ACE type | Percentage of adults | Lower Limit | Upper Limit | Numer- ator | Denom- inator |
|---|---|---|---|---|---|---|
Record Count: 16 | ||||||
| Utah | Emotional abuse | 44.5% | 42.4% | 46.5% | 1,581 | |
| Utah | Household substance misuse | 27.7% | 25.8% | 29.6% | 964 | |
| Utah | Household mental illness | 27.5% | 25.5% | 29.4% | 871 | |
| Utah | Parental separation/divorce | 25.9% | 24.1% | 27.8% | 876 | |
| Utah | Physical abuse | 30.5% | 28.7% | 32.4% | 1,125 | |
| Utah | Witnessed domestic violence | 19.6% | 17.9% | 21.2% | 658 | |
| Utah | Sexual abuse | 12.3% | 11.0% | 13.7% | 482 | |
| Utah | Incarcerated household member | 10.3% | 9.0% | 11.7% | 301 | |
| U.S. | Emotional abuse | 34.0% | 33.5% | 34.5% | 264,882 | |
| U.S. | Household substance misuse | 26.5% | 26.0% | 27.0% | 264,882 | |
| U.S. | Household mental illness | 17.3% | 16.9% | 17.7% | 264,882 | |
| U.S. | Parental separation/divorce | 28.4% | 27.9% | 28.9% | 264,882 | |
| U.S. | Physical abuse | 23.3% | 22.8% | 23.8% | 264,882 | |
| U.S. | Witnessed domestic violence | 17.2% | 16.8% | 17.7% | 264,882 | |
| U.S. | Sexual abuse | 12.6% | 12.2% | 13.0% | 264,882 | |
| U.S. | Incarcerated household member | 8.6% | 8.3% | 9.0% | 264,882 | |
Data Notes
All questions refer to the time period before respondents were 18 years of age. [[br]][[br]] Source of national data: Swedo EA, Aslam MV, Dahlberg LL, et al. Prevalence of Adverse Childhood Experiences Among U.S. Adults---Behavioral Risk Factor Surveillance System, 2011-2020. MMWR Morb Mortal Wkly Rep 2023;72:707-715. DOI: [http://dx.doi.org/10.15585/mmwr.mm7226a2].Data Sources
- Utah Department of Health and Human Services Behavioral Risk Factor Surveillance System (BRFSS) [https://ibis.health.utah.gov/ibisph-view/query/selection/brfss/BRFSSSelection.html]
- Behavioral Risk Factor Surveillance System Survey Data, US Department of Health and Human Services Centers for Disease Control and Prevention (CDC).
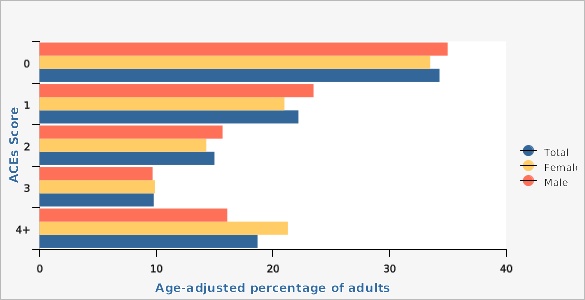
In Utah, 65.7% of adults have experienced at least one ACE, and over one in four have experienced three or more (28.5%). Among Utah women, 31.2% experienced three or more ACEs compared with 25.8% of men, a statistically significant difference. Females affirmed experiencing more household substance abuse, house mental illness, domestic violence, and emotional abuse. Also, females were two times more likely to affirm experiencing sexual abuse than males. Males affirmed experiencing more physical abuse and incarcerated household members.
| Males vs. Females | ACEs Score | Age-adjusted percentage of adults | Lower Limit | Upper Limit | Numer- ator | |
|---|---|---|---|---|---|---|
Record Count: 15 | ||||||
| Male | 0 | 35.0% | 33.6% | 36.3% | 3,065 | |
| Male | 1 | 23.5% | 22.3% | 24.7% | 2,066 | |
| Male | 2 | 15.7% | 14.7% | 16.8% | 1,280 | |
| Male | 3 | 9.7% | 8.9% | 10.6% | 765 | |
| Male | 4+ | 16.1% | 15.1% | 17.3% | 1,150 | |
| Female | 0 | 33.5% | 32.2% | 34.9% | 3,173 | |
| Female | 1 | 21.0% | 19.8% | 22.2% | 1,806 | |
| Female | 2 | 14.3% | 13.3% | 15.3% | 1,168 | |
| Female | 3 | 9.9% | 9.1% | 10.8% | 785 | |
| Female | 4+ | 21.3% | 20.1% | 22.5% | 1,594 | |
| Total | 0 | 34.3% | 33.4% | 35.2% | 6,246 | |
| Total | 1 | 22.2% | 21.4% | 23.0% | 3,873 | |
| Total | 2 | 15.0% | 14.3% | 15.7% | 2,449 | |
| Total | 3 | 9.8% | 9.2% | 10.4% | 1,552 | |
| Total | 4+ | 18.7% | 17.9% | 19.5% | 2,744 | |
Data Notes
All questions refer to the time period before respondents were 18 years of age. [[br]][[br]] Age-adjusted to the U.S. 2000 standard population.Data Source
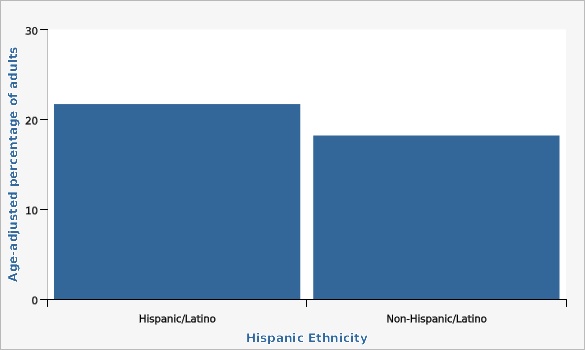
Utah Department of Health and Human Services Behavioral Risk Factor Surveillance System (BRFSS) [https://ibis.health.utah.gov/ibisph-view/query/selection/brfss/BRFSSSelection.html]Adults who report being Hispanic/Latino are impacted with an increased prevalence of 4+ ACEs compared with the state as a whole (21.7% vs 18.7%).
| Hispanic Ethnicity | Age-adjusted percentage of adults | Lower Limit | Upper Limit | Numer- ator | ||
|---|---|---|---|---|---|---|
Record Count: 2 | ||||||
| Hispanic/Latino | 21.7% | 19.1% | 24.5% | 323 | ||
| Non-Hispanic/Latino | 18.2% | 17.4% | 19.1% | 2,389 | ||
Data Notes
All questions refer to the time period before respondents were 18 years of age. [[br]][[br]] The 4+ ACE score is highlighted here because research suggests a higher prevalence of negative long-term impacts with higher ACE scores. Age-adjusted to the U.S. 2000 standard population.Data Source
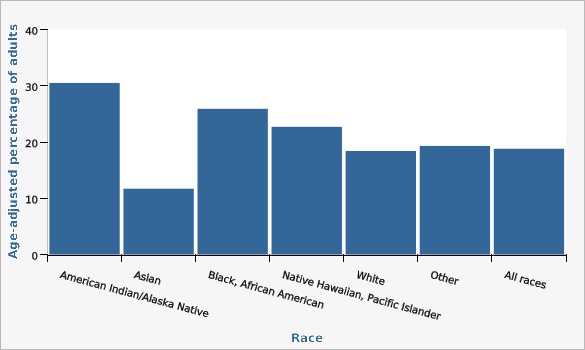
Utah Department of Health and Human Services Behavioral Risk Factor Surveillance System (BRFSS) [https://ibis.health.utah.gov/ibisph-view/query/selection/brfss/BRFSSSelection.html]Adults who report being American Indian or Alaska Native are impacted with the highest numbers of ACEs, with 30.5% having 4+ ACEs; followed by Black at 25.9%.
| Race | Age-adjusted percentage of adults | Lower Limit | Upper Limit | Note | Numer- ator | |
|---|---|---|---|---|---|---|
Record Count: 7 | ||||||
| American Indian/Alaska Native | 30.5% | 23.5% | 38.7% | significantly higher than the state | 80 | |
| Asian | 11.7% | 7.9% | 16.8% | significantly lower than the state | 30 | |
| Black, African American | 25.9% | 18.1% | 35.6% | 41 | ||
| Native Hawaiian, Pacific Islander | 22.7% | 15.5% | 31.9% | 26 | ||
| White | 18.4% | 17.5% | 19.2% | 2,427 | ||
| Other | 19.3% | 16.1% | 23.0% | 140 | ||
| All races | 18.8% | 18.0% | 19.6% | 2,744 | ||
Data Notes
All questions refer to the time period before respondents were 18 years of age. [[br]][[br]] The 4+ ACE score is highlighted here because research suggests a higher prevalence of negative long-term impacts with higher ACE scores. Age-adjusted to the U.S. 2000 standard population based on 3 age groups: 18-34, 35-49, and 50+.Data Source
Utah Department of Health and Human Services Behavioral Risk Factor Surveillance System (BRFSS) [https://ibis.health.utah.gov/ibisph-view/query/selection/brfss/BRFSSSelection.html]Adverse Childhood Experiences (ACEs) Prevalence by Type and Disability Status, Utah, 2018, 2020, and 2022
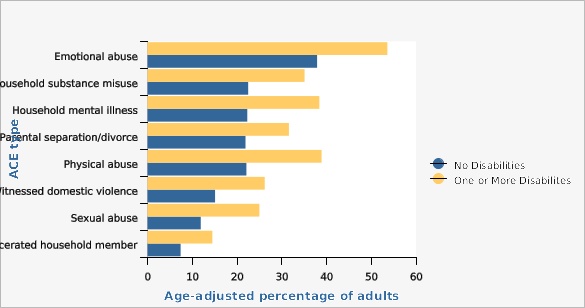
Compared to those with no disabilities, individuals with one or more disabilities indicated a statistically higher prevalence of experiencing all eight of the surveyed ACEs with sexual abuse being more than two times more prevalent (25.0% vs 11.9%).
| One or more disabilities vs No disabilities | ACE type | Age-adjusted percentage of adults | Lower Limit | Upper Limit | Numer- ator | |
|---|---|---|---|---|---|---|
Record Count: 16 | ||||||
| One or More Disabilites | Emotional abuse | 53.6% | 51.4% | 55.8% | 2,037 | |
| One or More Disabilites | Household substance misuse | 35.1% | 32.9% | 37.3% | 1,358 | |
| One or More Disabilites | Household mental illness | 38.4% | 36.4% | 40.6% | 1,273 | |
| One or More Disabilites | Parental separation/divorce | 31.6% | 29.6% | 33.8% | 1,119 | |
| One or More Disabilites | Physical abuse | 38.9% | 36.7% | 41.1% | 1,495 | |
| One or More Disabilites | Witnessed domestic violence | 26.2% | 24.2% | 28.3% | 932 | |
| One or More Disabilites | Sexual abuse | 25.0% | 23.1% | 27.0% | 929 | |
| One or More Disabilites | Incarcerated household member | 14.5% | 12.9% | 16.2% | 830 | |
| No Disabilities | Emotional abuse | 37.9% | 36.8% | 39.0% | 4,746 | |
| No Disabilities | Household substance misuse | 22.5% | 21.6% | 23.5% | 2,734 | |
| No Disabilities | Household mental illness | 22.3% | 21.4% | 23.2% | 2,700 | |
| No Disabilities | Parental separation/divorce | 21.9% | 21.0% | 22.9% | 2,618 | |
| No Disabilities | Physical abuse | 22.1% | 21.2% | 23.0% | 2,778 | |
| No Disabilities | Witnessed domestic violence | 15.1% | 14.3% | 15.9% | 1,745 | |
| No Disabilities | Sexual abuse | 11.9% | 11.2% | 12.6% | 1,528 | |
| No Disabilities | Incarcerated household member | 7.4% | 6.8% | 8.0% | 830 | |
Data Notes
All questions refer to the time period before respondents were 18 years of age. [[br]][[br]] Age-adjusted to the U.S. 2000 standard population.Data Source
Utah Department of Health and Human Services Behavioral Risk Factor Surveillance System (BRFSS) [https://ibis.health.utah.gov/ibisph-view/query/selection/brfss/BRFSSSelection.html]ACEs are common across all sociodemographic characteristics, yet some populations are more vulnerable to experiencing ACEs, such as children living in poverty and racial and ethnic minorities, because of the structural and social conditions in which some children and families live, learn, work, and play.
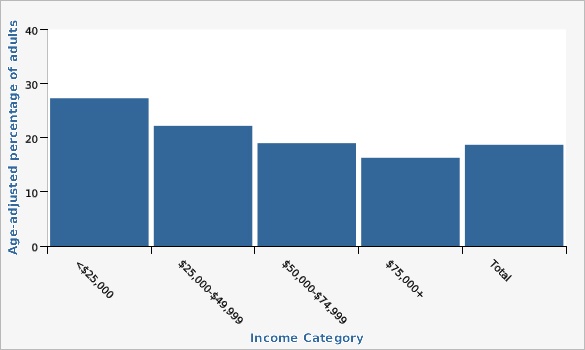
Lower-income households are impacted with significantly more ACEs than the state as a whole, 27.3% of adults living in households making less than $25,000 affirmed 4+ ACEs.
| Income Category | Age-adjusted percentage of adults | Lower Limit | Upper Limit | Numer- ator | ||
|---|---|---|---|---|---|---|
Record Count: 5 | ||||||
| <$25,000 | 27.3% | 24.6% | 30.3% | 456 | ||
| $25,000-$49,999 | 22.2% | 20.1% | 24.4% | 563 | ||
| $50,000-$74,999 | 19.0% | 17.0% | 21.1% | 427 | ||
| $75,000+ | 16.3% | 15.1% | 17.6% | 975 | ||
| Total | 18.7% | 17.9% | 19.5% | 2,744 | ||
Data Notes
All questions refer to the time period before respondents were 18 years of age. [[br]][[br]] The 4+ ACE score is highlighted here because research suggests a higher prevalence of negative long-term impacts with higher ACE scores. Age-adjusted to the U.S. 2000 standard population.Data Source
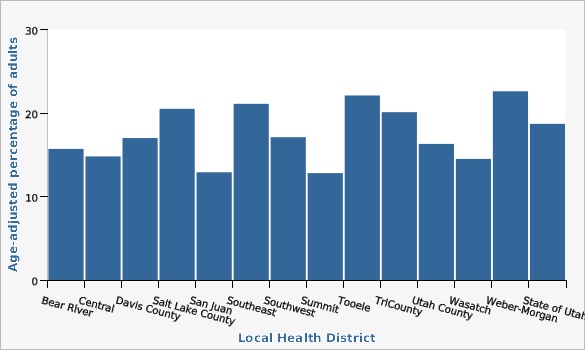
Utah Department of Health and Human Services Behavioral Risk Factor Surveillance System (BRFSS) [https://ibis.health.utah.gov/ibisph-view/query/selection/brfss/BRFSSSelection.html]Some local health districts (LHDs) are significantly impacted by higher or lower prevalence than the state overall. LHDs with a statistically higher prevalence of high ACE scores (4+ ACEs) include Salt Lake County and Weber-Morgan. LHDs with a statistically lower prevalence of high ACE scores include Central Utah, Summit County, and Utah County.
| Local Health District | Age-adjusted percentage of adults | Lower Limit | Upper Limit | Note | Numer- ator | |
|---|---|---|---|---|---|---|
Record Count: 14 | ||||||
| Bear River | 15.7% | 13.0% | 18.8% | 134 | ||
| Central | 14.8% | 11.8% | 18.4% | significantly lower than the state | 119 | |
| Davis County | 17.0% | 14.8% | 19.5% | 252 | ||
| Salt Lake County | 20.5% | 19.0% | 22.0% | significantly higher than the state | 863 | |
| San Juan | 12.9% | 7.9% | 20.5% | 27 | ||
| Southeast | 21.1% | 16.6% | 26.3% | 99 | ||
| Southwest | 17.1% | 14.3% | 20.2% | 171 | ||
| Summit | 12.8% | 8.6% | 18.5% | significantly lower than the state | 40 | |
| Tooele | 22.1% | 17.6% | 27.4% | 137 | ||
| TriCounty | 20.1% | 16.8% | 23.9% | 153 | ||
| Utah County | 16.3% | 14.6% | 18.1% | significantly lower than the state | 405 | |
| Wasatch | 14.5% | 10.0% | 20.6% | 48 | ||
| Weber-Morgan | 22.6% | 19.8% | 25.6% | significantly higher than the state | 268 | |
| State of Utah | 18.7% | 17.9% | 19.5% | 2,744 | ||
Data Notes
All questions refer to the time period before respondents were 18 years of age. [[br]][[br]] The 4+ ACE score is highlighted here because research suggests a higher prevalence of negative long-term impacts with higher ACE scores. Age-adjusted to the U.S. 2000 standard population.Data Source
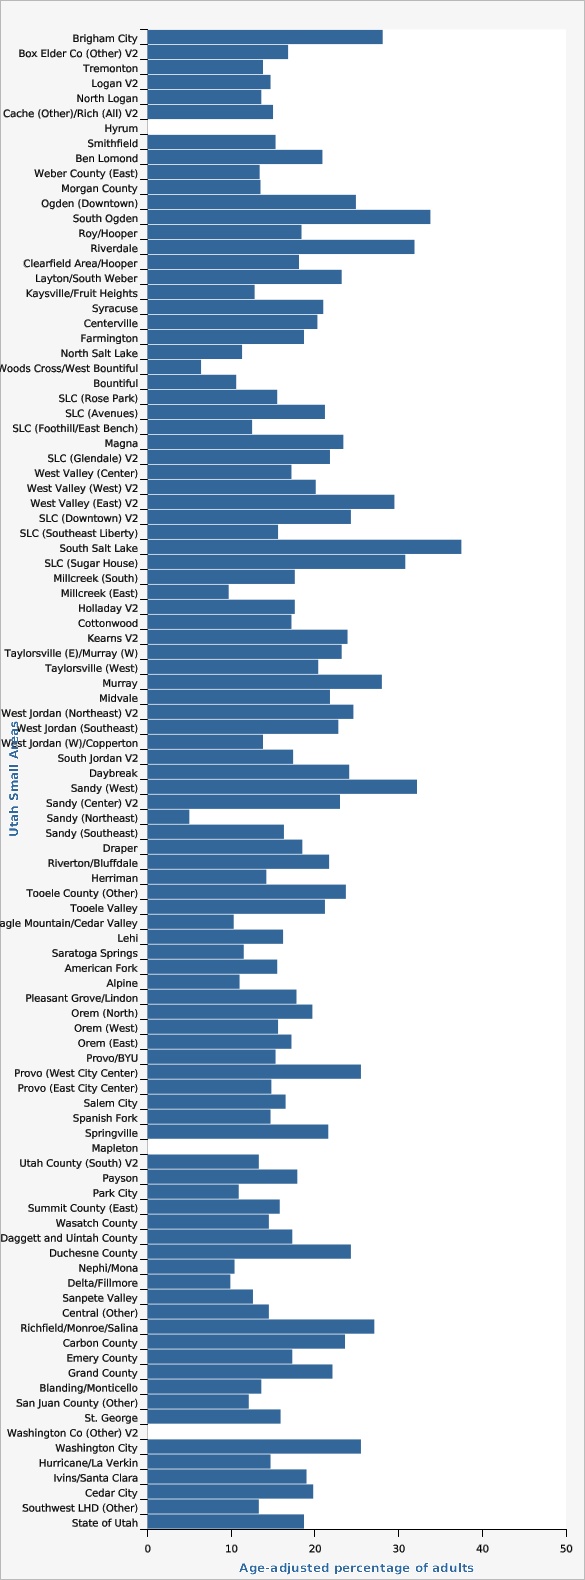
Utah Department of Health and Human Services Behavioral Risk Factor Surveillance System (BRFSS) [https://ibis.health.utah.gov/ibisph-view/query/selection/brfss/BRFSSSelection.html]To facilitate data reporting at the community level, Utah has been divided into 99 Small Areas. These areas are determined based on specific criteria, including population size, political boundaries of cities and towns, and economic similarity.
Some Utah Small Areas are significantly impacted by higher or lower prevalence than the state overall. The Utah Small Areas with statistically higher prevalence of high ACE scores (4+ ACEs) include Brigham City, South Ogden, Riverdale, West Valley (East) V2, South Salt Lake, Salt Lake City (Sugar House), Murray, and Sandy (West). The Utah Small Areas with a statistically lower prevalence of high ACE scores include Woods Cross/West Bountiful, Bountiful, Millcreek (East), Sandy (Northeast), Eagle Mountain/Cedar Valley, Saratoga Springs, and Delta/Fillmore.
| Utah Small Areas | Age-adjusted percentage of adults | Lower Limit | Upper Limit | Note | Numer- ator | |
|---|---|---|---|---|---|---|
Record Count: 100 | ||||||
| Brigham City | 28.1% | 19.7% | 38.5% | significantly higher than the state | 27 | |
| Box Elder Co (Other) V2 | 16.8% | 8.3% | 31.1% | * interpret w/caution | 12 | |
| Tremonton | 13.8% | 7.4% | 24.1% | * interpret w/caution | 13 | |
| Logan V2 | 14.7% | 10.3% | 20.6% | 39 | ||
| North Logan | 13.6% | 6.6% | 25.9% | * interpret w/caution | 11 | |
| Cache (Other)/Rich (All) V2 | 15.0% | 8.9% | 24.2% | 18 | ||
| Hyrum | ** | ** suppressed | ||||
| Smithfield | 15.3% | 7.5% | 28.5% | * interpret w/caution | 8 | |
| Ben Lomond | 20.9% | 15.9% | 26.9% | 62 | ||
| Weber County (East) | 13.4% | 8.8% | 19.7% | 30 | ||
| Morgan County | 13.5% | 6.5% | 25.9% | * interpret w/caution | 8 | |
| Ogden (Downtown) | 24.9% | 18.3% | 33.0% | 44 | ||
| South Ogden | 33.8% | 26.6% | 41.8% | significantly higher than the state | 47 | |
| Roy/Hooper | 18.4% | 13.2% | 25.1% | 41 | ||
| Riverdale | 31.9% | 22.2% | 25.1% | significantly higher than the state | 30 | |
| Clearfield Area/Hooper | 18.1% | 13.2% | 24.2% | 48 | ||
| Layton/South Weber | 23.2% | 18.0% | 29.4% | 72 | ||
| Kaysville/Fruit Heights | 12.8% | 8.5% | 19.0% | 25 | ||
| Syracuse | 21.0% | 13.7% | 30.7% | 26 | ||
| Centerville | 20.3% | 11.7% | 32.9% | 15 | ||
| Farmington | 18.7% | 11.3% | 29.2% | 20 | ||
| North Salt Lake | 11.3% | 5.3% | 22.7% | * interpret w/caution | 9 | |
| Woods Cross/West Bountiful | 6.4% | 2.6% | 15.0% | * interpret w/caution, significantly lower than state | 5 | |
| Bountiful | 10.6% | 6.7% | 16.2% | significantly lower than the state | 27 | |
| SLC (Rose Park) | 15.5% | 9.3% | 24.6% | 20 | ||
| SLC (Avenues) | 21.2% | 11.9% | 34.9% | 14 | ||
| SLC (Foothill/East Bench) | 12.5% | 5.8% | 24.8% | * interpret w/caution | 14 | |
| Magna | 23.4% | 14.5% | 35.3% | 22 | ||
| SLC (Glendale) V2 | 21.8% | 12.2% | 35.9% | 15 | ||
| West Valley (Center) | 17.2% | 12.0% | 24.0% | 41 | ||
| West Valley (West) V2 | 20.1% | 12.9% | 29.8% | 23 | ||
| West Valley (East) V2 | 29.5% | 22.3% | 38.0% | significantly higher than the state | 51 | |
| SLC (Downtown) V2 | 24.3% | 16.8% | 33.8% | 38 | ||
| SLC (Southeast Liberty) | 15.6% | 9.6% | 24.3% | 21 | ||
| South Salt Lake | 37.5% | 29.1% | 46.8% | significantly higher than the state | 37 | |
| SLC (Sugar House) | 30.8% | 22.6% | 40.3% | significantly higher than the state | 38 | |
| Millcreek (South) | 17.6% | 8.7% | 32.4% | * interpret w/caution | 9 | |
| Millcreek (East) | 9.7% | 4.9% | 18.1% | * interpret w/caution, significantly lower than state | 11 | |
| Holladay V2 | 17.6% | 10.4% | 28.1% | * interpret w/caution | 14 | |
| Cottonwood | 17.2% | 10.7% | 26.6% | 28 | ||
| Kearns V2 | 23.9% | 16.5% | 33.3% | 32 | ||
| Taylorsville (E)/Murray (W) | 23.2% | 16.5% | 31.7% | 33 | ||
| Taylorsville (West) | 20.4% | 14.0% | 28.7% | 30 | ||
| Murray | 28.0% | 20.9% | 36.5% | significantly higher than the state | 38 | |
| Midvale | 21.8% | 14.7% | 31.0% | 30 | ||
| West Jordan (Northeast) V2 | 24.6% | 16.3% | 35.3% | 25 | ||
| West Jordan (Southeast) | 22.8% | 15.6% | 32.1% | 30 | ||
| West Jordan (W)/Copperton | 13.8% | 8.8% | 20.8% | 22 | ||
| South Jordan V2 | 17.4% | 11.1% | 26.0% | 21 | ||
| Daybreak | 24.1% | 15.5% | 35.4% | 24 | ||
| Sandy (West) | 32.2% | 22.3% | 44.1% | significantly higher than the state | 25 | |
| Sandy (Center) V2 | 23.0% | 14.7% | 34.1% | 22 | ||
| Sandy (Northeast) | 5.0% | 2.0% | 11.5% | * interpret w/caution, significantly lower than state | 7 | |
| Sandy (Southeast) | 16.3% | 9.1% | 27.6% | * interpret w/caution | 13 | |
| Draper | 18.5% | 11.9% | 27.7% | 27 | ||
| Riverton/Bluffdale | 21.7% | 15.0% | 30.4% | 34 | ||
| Herriman | 14.2% | 9.4% | 20.9% | 27 | ||
| Tooele County (Other) | 23.7% | 15.2% | 34.9% | 29 | ||
| Tooele Valley | 21.2% | 16.4% | 26.9% | 105 | ||
| Eagle Mountain/Cedar Valley | 10.3% | 5.8% | 17.6% | significantly lower than the state | 17 | |
| Lehi | 16.2% | 12.0% | 21.4% | 50 | ||
| Saratoga Springs | 11.5% | 7.0% | 18.4% | significantly lower than the state | 19 | |
| American Fork | 15.5% | 10.4% | 22.6% | 27 | ||
| Alpine | 11.0% | 4.8% | 23.2% | * interpret w/caution | 6 | |
| Pleasant Grove/Lindon | 17.8% | 12.6% | 24.7% | 34 | ||
| Orem (North) | 19.7% | 12.8% | 29.1% | 27 | ||
| Orem (West) | 15.6% | 10.5% | 22.5% | 28 | ||
| Orem (East) | 17.2% | 9.9% | 28.2% | 19 | ||
| Provo/BYU | 15.3% | 9.5% | 23.7% | 21 | ||
| Provo (West City Center) | 25.5% | 17.8% | 35.0% | 33 | ||
| Provo (East City Center) | 14.8% | 7.6% | 26.8% | 16 | ||
| Salem City | 16.5% | 6.8% | 34.9% | * interpret w/caution | 5 | |
| Spanish Fork | 14.7% | 9.1% | 22.8% | 20 | ||
| Springville | 21.6% | 14.6% | 30.8% | 31 | ||
| Mapleton | ** | ** suppressed | ||||
| Utah County (South) V2 | 13.3% | 6.9% | 24.3% | * interpret w/caution | 9 | |
| Payson | 17.9% | 11.7% | 26.4% | 24 | ||
| Park City | 10.9% | 6.1% | 18.8% | 20 | ||
| Summit County (East) | 15.8% | 9.5% | 25.0% | 20 | ||
| Wasatch County | 14.5% | 10.0% | 20.6% | 48 | ||
| Daggett and Uintah County | 17.3% | 13.5% | 21.9% | 95 | ||
| Duchesne County | 24.3% | 18.6% | 31.1% | 58 | ||
| Nephi/Mona | 10.4% | 4.5% | 22.5% | * interpret w/caution | 8 | |
| Delta/Fillmore | 9.9% | 5.0% | 18.5% | * interpret w/caution, significantly lower than state | 13 | |
| Sanpete Valley | 12.6% | 7.8% | 19.7% | 31 | ||
| Central (Other) | 14.5% | 9.5% | 21.6% | 32 | ||
| Richfield/Monroe/Salina | 27.1% | 18.4% | 38.0% | 32 | ||
| Carbon County | 23.6% | 17.7% | 30.7% | 60 | ||
| Emery County | 17.3% | 10.1% | 28.0% | 20 | ||
| Grand County | 22.1% | 13.0% | 34.9% | 19 | ||
| Blanding/Monticello | 13.6% | 7.5% | 23.3% | * interpret w/caution | 18 | |
| San Juan County (Other) | 12.1% | 5.1% | 26.1% | * interpret w/caution | 9 | |
| St. George | 15.9% | 11.9% | 21.0% | 61 | ||
| Washington Co (Other) V2 | ** | ** suppressed | ||||
| Washington City | 25.5% | 16.6% | 37.1% | 25 | ||
| Hurricane/La Verkin | 14.7% | 8.0% | 25.6% | * interpret w/caution | 13 | |
| Ivins/Santa Clara | 19.0% | 9.2% | 35.1% | * interpret w/caution | 10 | |
| Cedar City | 19.8% | 13.9% | 27.4% | 34 | ||
| Southwest LHD (Other) | 13.3% | 7.6% | 22.3% | 18 | ||
| State of Utah | 18.7% | 17.9% | 19.5% | 2,744 | ||
Data Notes
All questions refer to the time period before respondents were 18 years of age. [[br]][[br]]*Use caution in interpreting; the estimate has a coefficient of variation > 30% and is therefore deemed unreliable by Utah Department of Health and Human Services standards. **The estimate has been suppressed because 1) the relative standard error is greater than 50% or 2) the observed number of events is very small and not appropriate for publication. The 4+ ACE score is highlighted here because research suggests a higher prevalence of negative long-term impacts with higher ACE scores. Age-adjusted to the U.S. 2000 standard population. A description of the Utah Small Areas may be found on IBIS at the following URL: [https://ibis.health.utah.gov/resource/Guidelines.html].Data Source
Utah Department of Health and Human Services Behavioral Risk Factor Surveillance System (BRFSS) [https://ibis.health.utah.gov/ibisph-view/query/selection/brfss/BRFSSSelection.html]More Resources and Links
Evidence-based community health improvement ideas and interventions may be found at the following sites:- Centers for Disease Control and Prevention (CDC) WONDER Database, a system for disseminating public health data and information.
- United States Census Bureau data dashboard.
- Utah healthy Places Index, evidence-based and peer-reviewed tool, supports efforts to prioritize equitable community investments, develop critical programs and policies across the state, and much more.
- County Health Rankings
- Kaiser Family Foundation's StateHealthFacts.org
- Medical literature can be queried at PubMed library.
Page Content Updated On 02/29/2024,
Published on 03/15/2024

