Complete Health Indicator Report of Disability Prevalence
Definition
Percentage of persons who responded yes to any of the following questions:[[br]] 1. Are you blind or do you have serious difficulty seeing, even when wearing glasses?[[br]] 2. Because of a physical, mental, or emotional condition, do you have serious difficulty concentrating, remembering, or making decisions?[[br]] 3. Do you have serious difficulty walking or climbing stairs?[[br]] 4. Do you have difficulty dressing or bathing?[[br]] 5. Because of a physical, mental, or emotional condition, do you have any difficulty doing errands alone such as visiting a doctor's office or shopping?[[br]] 6. Are you deaf or do you have serious difficulty hearing?Numerator
Includes survey respondents ages 18 and older who reported said "yes" to any of the the six questions on disabilities. Excludes those with missing, don't know, and refused answers.Denominator
Includes survey respondents ages 18 and older. Excludes those with missing, don't know, or refused answers.Data Interpretation Issues
Because age affects the likelihood of having various disabilities, it is beneficial to adjust for the effect of age when comparing populations. This helps determine if certain populations have factors that contribute to disability prevalence other than the effect of age. Beginning in 2011, BRFSS data included both landline and cell phone respondent data along with a new weighting methodology called iterative proportional fitting, or raking. This methodology utilizes additional demographic information (such as education, race, and marital status) in the weighting procedure. Both of these methodology changes were implemented to account for an increased number of U.S. households without landline phones and an under-representation of certain demographic groups that were not well-represented in the sample. More details about these changes can be found at: [https://ibis.health.utah.gov/pdf/opha/resource/brfss/RakingImpact2011.pdf].Why Is This Important?
One in every four adults in Utah and the United States has a disability.^1^ Disability is common, and yet, the disparities and needs of this community are often unrecognized and unfulfilled. Costly health events and chronic conditions such as, stroke, asthma, heart disease, diabetes, and cancer, are all more common for those with disabilities, and basic preventive services such as cancer screenings and dental checks are less common. Not only are people with disabilities more likely to experience significant differences in their health behaviors and health status than those without a disability, they are also more likely to experience social circumstances that put them at greater risk of having poor health outcomes, e.g. lower education, lower income, food insecurity, etc. It is important to understand that many of these differences and the size of these differences are avoidable, societally based, and not solely due to the nature of disability itself.^2^ As stated by Healthy People 2020, "To be healthy, all individuals with or without disabilities must have opportunities to take part in meaningful daily activities that add to their growth, development, fulfillment, and community contribution." This will require all public health programs, organizations, and communities to find ways to include people with disabilities in program activities and healthy communities. This can be achieved by utilizing the GRAIDs framework. A gap in the availability and accessibility of evidence-based programs led to the development of the [https://www.nchpad.org/fppics/NCHPAD_GRAIDs_Flyer_final.pdf Guidelines, Recommendations, Adaptations, Including Disability framework] (GRAIDs) by the National Centers on Health, Physical Activity and Disability (NCHPAD). The GRAIDs are an evidence-based method to adapt programs to be more inclusive of individuals with disabilities. The GRAIDs framework is applicable across programs, settings, sectors, and organizations. Applying the five GRAIDs domains will ensure accessibility and inclusion for individuals with disabilities in communities, programs, services, and organizations.[[br]] [[br]] ---- 1. Utah Department of Health and Human Services. Behavioral Risk Factor Surveillance System (BRFSS), Salt Lake City: Utah Department of Health, Center for Health Data.[[br]] 2. Krahn G.H., Walker D.K., Correa-De-Araujo R. Persons with disabilities as an unrecognized health disparity population. AJPH. 2015;105:S198?S206. [https://www.ncbi.nlm.nih.gov/pmc/articles/PMC4355692/].[[br]]Other Objectives
Other Healthy People 2030 Objectives include: *DH-01: Reduce the proportion of adults with disabilities aged 18 years and older who experience delays in receiving primary and periodic preventive care due to cost. *0A-01: Increase the proportion of older adults with reduced physical or cognitive function who engage in light, moderate, or vigorous leisure-time physical activities.How Are We Doing?
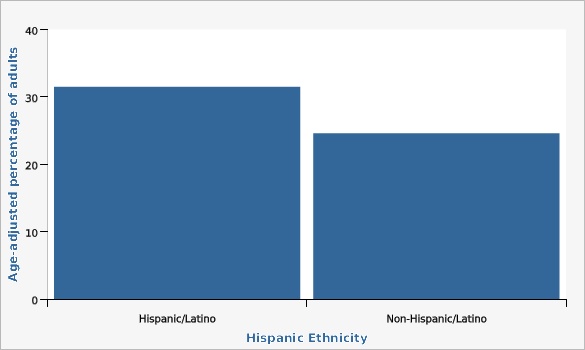
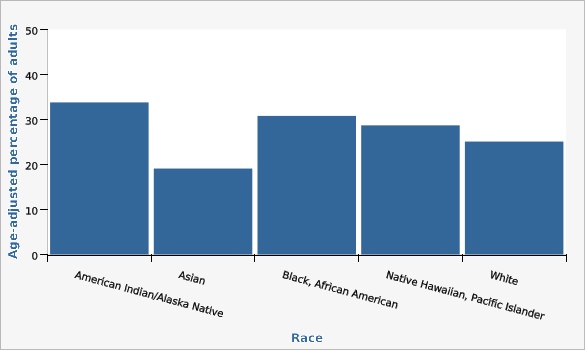
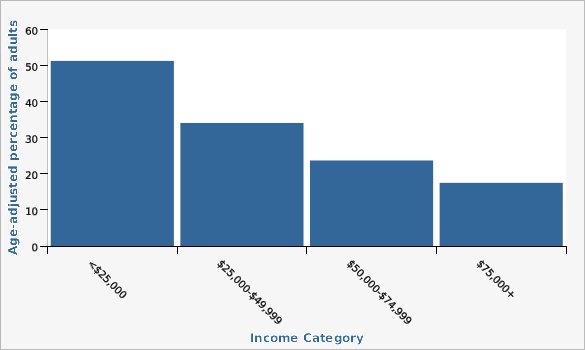
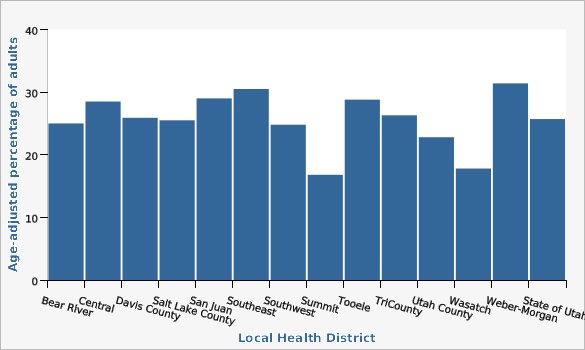
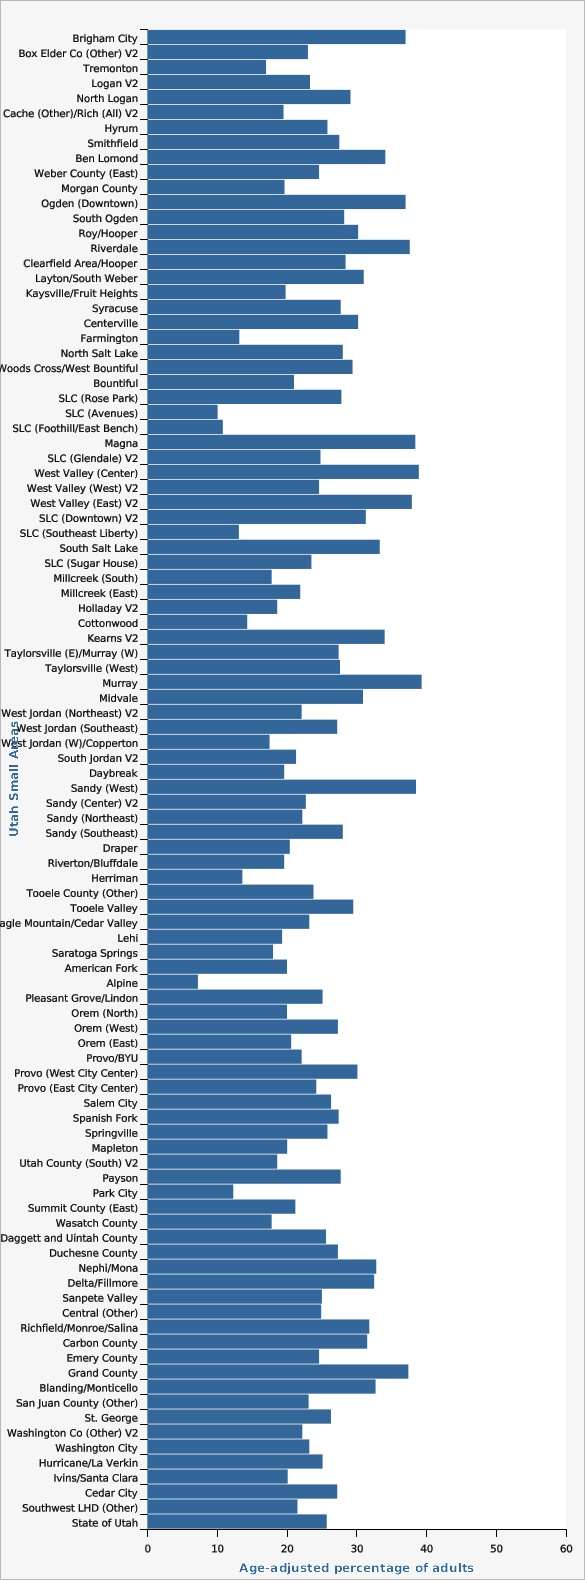
One in every four Utah adults reports having one or more disabilities. A disability can occur at any age and most people will experience a disability at some point in their life. The most commonly reported disability in 2022 among Utah adults was cognitive (14.1%), which means the person has difficulty concentrating, remembering, or making decisions. Mobility disability was the second most commonly reported disability (9.1%), followed by independent living disability (i.e. inability to drive oneself to doctor appointments or run errands alone, 6.5%), difficulty hearing/deaf (6.1%), difficulty seeing/blind (3.5%), and limitations in the ability to care for oneself such as dressing and bathing (i.e. self-care disability, 2.6%). The likelihood of having a disability varies with social circumstances and geographic location. Hispanic adults (31.5%) were more likely than non-Hispanic adults to have a disability (24.6%). American Indian/Alaska Native adults and Black and African American adults had the highest disability rates compared to other races with 33.8% and 30.8% reporting a disability, respectively. Lower incomes are correlated to higher disability rates. Among Utah adults, 51.3% of those that made less than $25,000 a year had a disability compared to 17.5% of those that made more than $75,000 a year. Local health districts with higher rates of people reporting a disability included Weber-Morgan, Southeast Utah, and San Juan. See the [[a href="indicator/view/Dis.LHD.html" Local Health District data view]] for more information. Looking at smaller geographic areas, greater variation is seen in the rate of disabilities. For example, within Salt Lake County, 39.3% of adults in Murray reported having a disability whereas 10.8% of adults had a disability in the Foothill/East Bench area of Salt Lake City. See the [[a href="indicator/view/Dis.SA.html" Utah Small Area data view]] for more information. Lastly, overall disability rates increase with age. Adults 65 years and older are much more likely to report having one or more disabilities. Among adults aged 64 and younger, women were significantly more likely than men to have a disability.How Do We Compare With the U.S.?
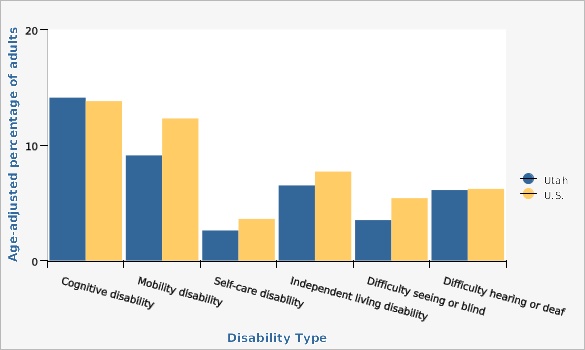
The age-adjusted prevalence of disability in Utah was 26.4% in 2022, which was lower than the U.S. rate of 28.5%.What Is Being Done?
Due to the need for programmatic, policy, and environmentally based inclusion strategies, the Centers for Disease Control and Prevention awarded the Disability and Health Program (DHP) at the Utah Department of Health and Human Services a five-year (2021-2026) grant to increase resources and reduce disparities for people with disabilities. Quarterly meetings that guide inclusion efforts occur with the Utah Disability Advisory Committee, which is comprised of people with disabilities, public health management, and organizations that specialize in and serve people with disabilities. Current strategies include: *Training public health administration and staff to increase the level of inclusion and access for people with disabilities in their programs and organizations, *Administering a training for healthcare providers on accessible preventive health care, *Implementing a project to link adults with intellectual and other developmental disabilities to preventive health care or health promotion programs in their communities, *Implementing and evaluating evidence-based health promotion interventions as well as policy, system and environmental (PSE) changes, and *Developing and disseminating resources and tools to address health disparities among adults with disabilities.Evidence-based Practices
^ ^ Public health leaders and staff can use the [https://www.nchpad.org/fppics/NCHPAD_GRAIDs_Flyer_final.pdf GRAIDs framework] developed by the National Center on Health, Physical Activity and Disability (NCHPAD), to increase the inclusivity and accessibility of health promotion programs and services.Available Services
Services include: *[https://familyhealth.utah.gov/cshcn/aata/ Adult Autism Treatment Account] if eligible, provides funding for treatment for adults with autism *[https://familyhealth.utah.gov/oec/baby-watch-early-intervention/ Baby Watch Early Intervention] provides support and services to families with children from birth to age three years who have developmental delays or disabilities *[https://familyhealth.utah.gov/cshcn/ Children with Special Health Care Needs] provides a variety of services and education for families with children with special health care needs *[https://familyhealth.utah.gov/cshcn/ehdi/ Early Hearing Detection and Intervention] resources include the [https://familyhealth.utah.gov/cshcn/chap/ Children's Hearing Aid Program, Hearing Aid Recycling Program], newborn hearing screening, CMV education, and other audiology services *[https://healthyaging.utah.gov/ Healthy Aging Program] promotes evidence-based classes to empower adults to age well *[https://takecareutah.org/linkage-coordinator-project/ Linkage Project] is a free program that helps connect people with IDD and mobility limitations to needed services and care *[https://healthyaging.utah.gov/find-workshop/#/ Living Well] lists a variety of evidence-based programs and workshops in the community that can help you manage health problems such as asthma, diabetes, arthritis, tobacco use, pain management, injury prevention, etc. Alternatively, you can call the Health Resource Line at 1-888-222-2542 to find and register for a class near you. *[https://medicaid.utah.gov/ Medicaid] and [https://medicaid.utah.gov/ltc/ Medicaid Waiver Services] are sources of health care coverage for people with disabilities; available waivers include Acquired Brain Injury Waiver, Aging Waiver, Community Supports Waiver for Individuals with Intellectual Disabilities or Other Related Conditions, Medicaid Autism Waiver, Medically Complex Children's Waiver, New Choices Waiver, Physical Disabilities Waiver, and Waiver for Technology Dependent Children *[https://familyhealth.utah.gov/cshcn/ubdn/ The Utah Birth Defect Network] is a statewide, population-based surveillance system that identifies birth defects in children born in Utah and provides education to families on the prevention of birth defects *[https://vipp.utah.gov/traumatic-brain-injury/ Utah Traumatic Brain Injury Fund]Related Indicators
Relevant Population Characteristics
As the Utah population ages, a greater percentage of Utahns will report experiencing a disability. Disability is also negatively correlated with education and income. This means as a person's income or education decrease, disability rates increase. This is likely partially due to disability limiting educational and income opportunities. Disability rates vary by ethnicity, with the Hispanic population being the more likely to report a disability in Utah, and race, with the American Indian/Alaskan Native population reporting disability at higher rates.Related Relevant Population Characteristics Indicators:
Health Care System Factors
The aging population in Utah is likely to lead to an increase in the prevalence of disabilities that can have dramatic consequences in terms of health care expenditures. Access to health care is still a problem for many Utahns. Individuals who cannot obtain needed health care tend to have higher rates of death and disability from chronic disease. Cost is the most commonly reported barrier to getting needed health care. Adults with a disability are much more likely to report that they were unable to get needed medical care due to cost compared to those without a disability. People with disabilities are significantly less likely to report receiving preventive screenings or to have visited a dentist in the past year. See [https://www.cdc.gov/ncbddd/disabilityandhealth/dhds/index.html] for data on people with disabilities in Utah.Related Health Care System Factors Indicators:
Risk Factors
Utah adults with a disability are more likely to report engaging in behaviors that are harmful to their health, such as smoking. They also report eating less fruits and vegetables on a daily basis and getting less exercise than adults without a disability.Related Risk Factors Indicators:
- Daily Fruit Consumption
- Daily Vegetable Consumption
- Alcohol Consumption - Binge Drinking
- Smoking Among Adults
- Electronic Cigarettes / Vape Products
- Obesity Among Adults
- Overweight or Obese
- Physical Activity: Recommended Aerobic Activity Among Adults
- Physical Activity: Recommended Muscle-strengthening Among Adults
Health Status Outcomes
Utah adults with disabilities are more likely to report a variety of poor health outcomes at higher rates than the those without disabilities, such as, arthritis, asthma, cancer, diabetes, heart disease, and stroke. Due to the nature of disability, these conditions can be outcomes of as well as precursors to disability.Related Health Status Outcomes Indicators:
Graphical Data Views
After age-adjusting the data, Hispanic adults are more likely to have a disability than non-Hispanic adults in Utah (31.5% vs. 24.6%).
| Hispanic Ethnicity | Age-adjusted percentage of adults | Lower Limit | Upper Limit | |||
|---|---|---|---|---|---|---|
Record Count: 2 | ||||||
| Hispanic/Latino | 31.5% | 28.9% | 34.3% | |||
| Non-Hispanic/Latino | 24.6% | 23.8% | 25.5% | |||
Data Notes
Disability status is self-reported and not confirmed by a health-care provider; however, such self-reports have been shown to be acceptable for surveillance purposes. For purposes of this report, "disability" is defined as someone who said "yes" to one or more of the following questions:[[br]] 1. Are you blind or do you have serious difficulty seeing, even when wearing glasses?[[br]] 2. Because of a physical, mental, or emotional condition, do you have serious difficulty concentrating, remembering, or making decisions?[[br]] 3. Do you have serious difficulty walking or climbing stairs?[[br]] 4. Do you have difficulty dressing or bathing?[[br]] 5. Because of a physical, mental, or emotional condition, do you have any difficulty doing errands alone such as visiting a doctor's office or shopping?[[br]] 6. Are you deaf or do you have serious difficulty hearing?. [[br]] [[br]]Age-adjusted to U.S. 2000 standard population.Data Source
Utah Department of Health and Human Services Behavioral Risk Factor Surveillance System (BRFSS) [https://ibis.health.utah.gov/ibisph-view/query/selection/brfss/BRFSSSelection.html]The percentage of adults with disabilities among American Indian/Alaska Native and Black populations was significantly higher than the state rate of 25.7%.
Note: American Indian/Alaskan Native persons are often underrepresented and oversampled in surveys.
| Race | Age-adjusted percentage of adults | Lower Limit | Upper Limit | |||
|---|---|---|---|---|---|---|
Record Count: 5 | ||||||
| American Indian/Alaska Native | 33.8% | 26.5% | 42.0% | |||
| Asian | 19.1% | 14.1% | 25.4% | |||
| Black, African American | 30.8% | 23.8% | 38.7% | |||
| Native Hawaiian, Pacific Islander | 28.7% | 18.7% | 41.2% | |||
| White | 25.1% | 24.3% | 26.0% | |||
Data Notes
Disability status is self-reported and not confirmed by a health-care provider; however, such self-reports have been shown to be acceptable for surveillance purposes. For purposes of this report, "disability" is defined as someone who said "yes" to one or more of the following questions:[[br]] 1. Are you blind or do you have serious difficulty seeing, even when wearing glasses?[[br]] 2. Because of a physical, mental, or emotional condition, do you have serious difficulty concentrating, remembering, or making decisions?[[br]] 3. Do you have serious difficulty walking or climbing stairs?[[br]] 4. Do you have difficulty dressing or bathing?[[br]] 5. Because of a physical, mental, or emotional condition, do you have any difficulty doing errands alone such as visiting a doctor's office or shopping?[[br]] 6. Are you deaf or do you have serious difficulty hearing?. [[br]] [[br]]Age-adjusted to U.S. 2000 standard population based on 3 age groups.Data Source
Utah Department of Health and Human Services Behavioral Risk Factor Surveillance System (BRFSS) [https://ibis.health.utah.gov/ibisph-view/query/selection/brfss/BRFSSSelection.html]Significant differences exist between income brackets. Utah adults with a lower annual income are more likely to report having a disability.
| Income Category | Age-adjusted percentage of adults | Lower Limit | Upper Limit | |||
|---|---|---|---|---|---|---|
Record Count: 4 | ||||||
| <$25,000 | 51.3% | 47.9% | 54.7% | |||
| $25,000-$49,999 | 34.1% | 32.0% | 36.2% | |||
| $50,000-$74,999 | 23.7% | 21.7% | 25.8% | |||
| $75,000+ | 17.5% | 16.3% | 18.7% | |||
Data Notes
Disability status is self-reported and not confirmed by a health-care provider; however, such self-reports have been shown to be acceptable for surveillance purposes. For purposes of this report, "disability" is defined as someone who said "yes" to one or more of the following questions:[[br]] 1. Are you blind or do you have serious difficulty seeing, even when wearing glasses?[[br]] 2. Because of a physical, mental, or emotional condition, do you have serious difficulty concentrating, remembering, or making decisions?[[br]] 3. Do you have serious difficulty walking or climbing stairs?[[br]] 4. Do you have difficulty dressing or bathing?[[br]] 5. Because of a physical, mental, or emotional condition, do you have any difficulty doing errands alone such as visiting a doctor's office or shopping?[[br]] 6. Are you deaf or do you have serious difficulty hearing?. [[br]] [[br]]Age-adjusted to U.S. 2000 standard population.Data Source
Utah Department of Health and Human Services Behavioral Risk Factor Surveillance System (BRFSS) [https://ibis.health.utah.gov/ibisph-view/query/selection/brfss/BRFSSSelection.html]Local health districts (LHDs) with a significantly higher disability prevalence than the state include:
*Weber-Morgan [[br]]
[[br]]
LHDs with a significantly lower prevalence of adults reporting having a disability included:
*Summit County
*Utah County
*Wasatch County[[br]]
[[br]]
Bear River, Central Utah, Davis County, Salt Lake County, San Juan, Southeast Utah, Southwest Utah, Tooele County, and TriCounty LHDs were not considered different from the state percentage of people living with a disability.
| Local Health District | Age-adjusted percentage of adults | Lower Limit | Upper Limit | |||
|---|---|---|---|---|---|---|
Record Count: 14 | ||||||
| Bear River | 25.0% | 21.9% | 28.3% | |||
| Central | 28.5% | 24.9% | 32.5% | |||
| Davis County | 25.9% | 23.3% | 28.6% | |||
| Salt Lake County | 25.5% | 24.1% | 26.9% | |||
| San Juan | 29.0% | 21.2% | 38.3% | |||
| Southeast | 30.5% | 25.6% | 36.0% | |||
| Southwest | 24.8% | 21.9% | 27.8% | |||
| Summit | 16.8% | 12.2% | 22.7% | |||
| Tooele | 28.8% | 24.9% | 33.2% | |||
| TriCounty | 26.3% | 22.9% | 30.1% | |||
| Utah County | 22.8% | 21.2% | 24.5% | |||
| Wasatch | 17.8% | 13.1% | 23.7% | |||
| Weber-Morgan | 31.4% | 28.6% | 34.5% | |||
| State of Utah | 25.7% | 24.9% | 26.5% | |||
Data Notes
Disability status is self-reported and not confirmed by a health-care provider; however, such self-reports have been shown to be acceptable for surveillance purposes. For purposes of this report, "disability" is defined as someone who said "yes" to one or more of the following questions:[[br]] 1. Are you blind or do you have serious difficulty seeing, even when wearing glasses?[[br]] 2. Because of a physical, mental, or emotional condition, do you have serious difficulty concentrating, remembering, or making decisions?[[br]] 3. Do you have serious difficulty walking or climbing stairs?[[br]] 4. Do you have difficulty dressing or bathing?[[br]] 5. Because of a physical, mental, or emotional condition, do you have any difficulty doing errands alone such as visiting a doctor's office or shopping?[[br]] 6. Are you deaf or do you have serious difficulty hearing?. [[br]] [[br]]Age-adjusted to U.S. 2000 standard population.Data Source
Utah Department of Health and Human Services Behavioral Risk Factor Surveillance System (BRFSS) [https://ibis.health.utah.gov/ibisph-view/query/selection/brfss/BRFSSSelection.html]| Utah Small Areas | Age-adjusted percentage of adults | Lower Limit | Upper Limit | Note | ||
|---|---|---|---|---|---|---|
Record Count: 100 | ||||||
| Brigham City | 37.0% | 28.0% | 47.0% | |||
| Box Elder Co (Other) V2 | 23.0% | 14.0% | 35.3% | |||
| Tremonton | 17.0% | 11.2% | 24.9% | |||
| Logan V2 | 23.3% | 18.0% | 29.5% | |||
| North Logan | 29.1% | 20.3% | 39.9% | |||
| Cache (Other)/Rich (All) V2 | 19.5% | 12.8% | 28.5% | |||
| Hyrum | 25.8% | 15.7% | 39.5% | |||
| Smithfield | 27.5% | 16.4% | 42.3% | |||
| Ben Lomond | 34.1% | 28.3% | 40.5% | |||
| Weber County (East) | 24.6% | 18.2% | 32.5% | |||
| Morgan County | 19.6% | 16.1% | 23.8% | * | ||
| Ogden (Downtown) | 37.0% | 29.9% | 44.7% | |||
| South Ogden | 28.2% | 22.0% | 35.5% | |||
| Roy/Hooper | 30.2% | 23.4% | 38.0% | |||
| Riverdale | 37.6% | 27.4% | 49.1% | |||
| Clearfield Area/Hooper | 28.4% | 22.9% | 34.7% | |||
| Layton/South Weber | 31.0% | 25.5% | 37.2% | |||
| Kaysville/Fruit Heights | 19.8% | 13.1% | 28.6% | |||
| Syracuse | 27.7% | 20.0% | 36.9% | |||
| Centerville | 30.2% | 19.3% | 44.0% | |||
| Farmington | 13.2% | 6.4% | 25.2% | * | ||
| North Salt Lake | 28.0% | 17.8% | 41.0% | |||
| Woods Cross/West Bountiful | 29.4% | 20.0% | 40.9% | |||
| Bountiful | 21.0% | 15.8% | 27.3% | |||
| SLC (Rose Park) | 27.8% | 20.1% | 37.0% | |||
| SLC (Avenues) | 10.1% | 6.4% | 15.3% | * | ||
| SLC (Foothill/East Bench) | 10.8% | 6.5% | 17.4% | |||
| Magna | 38.4% | 30.5% | 46.9% | |||
| SLC (Glendale) V2 | 24.8% | 15.4% | 37.2% | |||
| West Valley (Center) | 38.9% | 31.2% | 47.3% | |||
| West Valley (West) V2 | 24.6% | 16.8% | 34.4% | |||
| West Valley (East) V2 | 37.9% | 30.2% | 46.2% | |||
| SLC (Downtown) V2 | 31.3% | 23.7% | 40.1% | |||
| SLC (Southeast Liberty) | 13.1% | 7.7% | 21.4% | |||
| South Salt Lake | 33.3% | 24.4% | 43.6% | |||
| SLC (Sugar House) | 23.5% | 17.2% | 31.4% | |||
| Millcreek (South) | 17.8% | 10.8% | 27.9% | |||
| Millcreek (East) | 21.9% | 14.3% | 32.2% | |||
| Holladay V2 | 18.6% | 11.6% | 28.6% | |||
| Cottonwood | 14.3% | 9.5% | 21.0% | |||
| Kearns V2 | 34.0% | 26.9% | 41.9% | |||
| Taylorsville (E)/Murray (W) | 27.4% | 21.0% | 35.0% | |||
| Taylorsville (West) | 27.6% | 20.8% | 35.6% | |||
| Murray | 39.3% | 31.0% | 48.3% | |||
| Midvale | 30.9% | 23.6% | 39.4% | |||
| West Jordan (Northeast) V2 | 22.1% | 15.3% | 30.8% | |||
| West Jordan (Southeast) | 27.2% | 19.8% | 36.1% | |||
| West Jordan (W)/Copperton | 17.5% | 11.7% | 25.3% | |||
| South Jordan V2 | 21.3% | 14.4% | 30.4% | |||
| Daybreak | 19.6% | 13.2% | 28.3% | |||
| Sandy (West) | 38.5% | 27.8% | 50.6% | |||
| Sandy (Center) V2 | 22.7% | 15.6% | 31.8% | |||
| Sandy (Northeast) | 22.2% | 13.9% | 33.5% | |||
| Sandy (Southeast) | 28.0% | 19.9% | 37.8% | |||
| Draper | 20.4% | 14.4% | 28.0% | |||
| Riverton/Bluffdale | 19.6% | 14.5% | 25.9% | |||
| Herriman | 13.6% | 9.4% | 19.3% | |||
| Tooele County (Other) | 23.8% | 16.3% | 33.3% | |||
| Tooele Valley | 29.5% | 25.1% | 34.4% | |||
| Eagle Mountain/Cedar Valley | 23.2% | 16.3% | 32.0% | |||
| Lehi | 19.3% | 15.0% | 24.4% | |||
| Saratoga Springs | 18.0% | 11.7% | 26.6% | |||
| American Fork | 20.0% | 14.7% | 26.5% | |||
| Alpine | 7.2% | 3.1% | 16.2% | * | ||
| Pleasant Grove/Lindon | 25.1% | 20.2% | 30.6% | |||
| Orem (North) | 20.0% | 14.2% | 27.3% | |||
| Orem (West) | 27.3% | 22.1% | 33.2% | |||
| Orem (East) | 20.6% | 14.0% | 29.1% | |||
| Provo/BYU | 22.1% | 16.6% | 28.7% | |||
| Provo (West City Center) | 30.1% | 23.1% | 38.0% | |||
| Provo (East City Center) | 24.2% | 15.2% | 36.3% | |||
| Salem City | 26.3% | 15.3% | 41.3% | * | ||
| Spanish Fork | 27.4% | 21.2% | 34.7% | |||
| Springville | 25.8% | 19.5% | 33.2% | |||
| Mapleton | 20.0% | 13.0% | 29.6% | * | ||
| Utah County (South) V2 | 18.6% | 11.0% | 29.8% | |||
| Payson | 27.7% | 19.6% | 37.6% | |||
| Park City | 12.3% | 7.7% | 19.1% | |||
| Summit County (East) | 21.2% | 13.9% | 31.0% | |||
| Wasatch County | 17.8% | 13.1% | 23.7% | |||
| Daggett and Uintah County | 25.6% | 21.3% | 30.3% | |||
| Duchesne County | 27.3% | 21.6% | 33.8% | |||
| Nephi/Mona | 32.8% | 21.0% | 47.3% | |||
| Delta/Fillmore | 32.5% | 20.7% | 46.9% | |||
| Sanpete Valley | 25.0% | 17.6% | 34.3% | |||
| Central (Other) | 24.9% | 19.2% | 31.5% | |||
| Richfield/Monroe/Salina | 31.8% | 24.6% | 39.9% | |||
| Carbon County | 31.5% | 25.4% | 38.3% | |||
| Emery County | 24.6% | 16.4% | 35.2% | |||
| Grand County | 37.4% | 26.7% | 49.5% | |||
| Blanding/Monticello | 32.7% | 22.3% | 45.2% | |||
| San Juan County (Other) | 23.1% | 13.7% | 36.1% | |||
| St. George | 26.3% | 21.7% | 31.5% | |||
| Washington Co (Other) V2 | 22.2% | 12.4% | 36.5% | |||
| Washington City | 23.2% | 15.0% | 33.9% | |||
| Hurricane/La Verkin | 25.1% | 17.6% | 34.5% | |||
| Ivins/Santa Clara | 20.1% | 11.1% | 33.7% | |||
| Cedar City | 27.2% | 20.9% | 34.5% | |||
| Southwest LHD (Other) | 21.5% | 14.3% | 31.1% | |||
| State of Utah | 25.7% | 24.9% | 26.5% | |||
Data Notes
Disability status is self-reported and not confirmed by a health-care provider; however, such self-reports have been shown to be acceptable for surveillance purposes. For purposes of this report, "disability" is defined as someone who said "yes" to one or more of the following questions:[[br]] 1. Are you blind or do you have serious difficulty seeing, even when wearing glasses?[[br]] 2. Because of a physical, mental, or emotional condition, do you have serious difficulty concentrating, remembering, or making decisions?[[br]] 3. Do you have serious difficulty walking or climbing stairs?[[br]] 4. Do you have difficulty dressing or bathing?[[br]] 5. Because of a physical, mental, or emotional condition, do you have any difficulty doing errands alone such as visiting a doctor's office or shopping?[[br]] 6. Are you deaf or do you have serious difficulty hearing?. [[br]] [[br]]Age-adjusted to U.S. 2000 standard population. *Use caution in interpreting; the estimate has a coefficient of variation >30% and is therefore deemed unreliable by Utah Department of Health and Human Services standards.Data Source
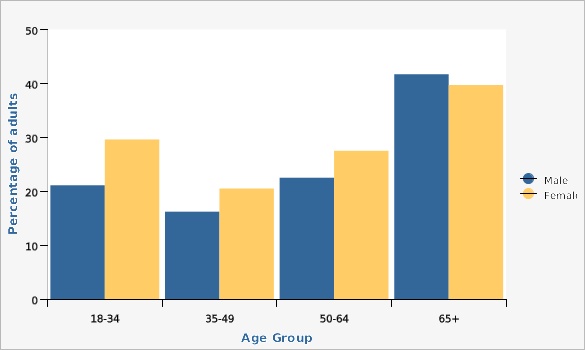
Utah Department of Health and Human Services Behavioral Risk Factor Surveillance System (BRFSS) [https://ibis.health.utah.gov/ibisph-view/query/selection/brfss/BRFSSSelection.html]In general, the likelihood of having a disability increases with age.
For age groups 18 to 34, 35 to 49, and 50-64, women were significantly more likely than men to have a disability.
| Males vs. Females | Age Group | Percentage of adults | Lower Limit | Upper Limit | ||
|---|---|---|---|---|---|---|
Record Count: 8 | ||||||
| Male | 18-34 | 21.1% | 19.2% | 23.2% | ||
| Male | 35-49 | 16.2% | 14.4% | 18.1% | ||
| Male | 50-64 | 22.5% | 20.4% | 24.7% | ||
| Male | 65+ | 41.7% | 39.3% | 44.3% | ||
| Female | 18-34 | 29.6% | 27.2% | 32.1% | ||
| Female | 35-49 | 20.5% | 18.5% | 22.6% | ||
| Female | 50-64 | 27.5% | 25.1% | 30.1% | ||
| Female | 65+ | 39.7% | 37.4% | 42.1% | ||
Data Notes
Disability status is self-reported and not confirmed by a health-care provider; however, such self-reports have been shown to be acceptable for surveillance purposes. For purposes of this report, "disability" is defined as someone who said "yes" to one or more of the following questions:[[br]] 1. Are you blind or do you have serious difficulty seeing, even when wearing glasses?[[br]] 2. Because of a physical, mental, or emotional condition, do you have serious difficulty concentrating, remembering, or making decisions?[[br]] 3. Do you have serious difficulty walking or climbing stairs?[[br]] 4. Do you have difficulty dressing or bathing?[[br]] 5. Because of a physical, mental, or emotional condition, do you have any difficulty doing errands alone such as visiting a doctor's office or shopping?[[br]] 6. Are you deaf or do you have serious difficulty hearing?Data Source
Utah Department of Health and Human Services Behavioral Risk Factor Surveillance System (BRFSS) [https://ibis.health.utah.gov/ibisph-view/query/selection/brfss/BRFSSSelection.html]One in every four Utah adults has as disability (26.4% age-adjusted rate; 26.8% crude rate). This is slightly lower than the national prevalence of 28.5%. The most common type of disability in Utah is cognitive (14.1%) followed by mobility disability (9.1%).
| Utah vs. U.S. | Disability Type | Age-adjusted percentage of adults | Lower Limit | Upper Limit | ||
|---|---|---|---|---|---|---|
Record Count: 12 | ||||||
| Utah | Cognitive disability | 14.1% | 13.1% | 15.2% | ||
| Utah | Mobility disability | 9.1% | 8.5% | 9.9% | ||
| Utah | Self-care disability | 2.6% | 2.2% | 3.0% | ||
| Utah | Independent living disability | 6.5% | 5.8% | 7.2% | ||
| Utah | Difficulty seeing or blind | 3.5% | 3.0% | 4.1% | ||
| Utah | Difficulty hearing or deaf | 6.1% | 5.6% | 6.7% | ||
| U.S. | Cognitive disability | 13.8% | 13.5% | 14.0% | ||
| U.S. | Mobility disability | 12.3% | 12.1% | 12.5% | ||
| U.S. | Self-care disability | 3.6% | 3.5% | 3.7% | ||
| U.S. | Independent living disability | 7.7% | 7.5% | 7.9% | ||
| U.S. | Difficulty seeing or blind | 5.4% | 5.2% | 5.5% | ||
| U.S. | Difficulty hearing or deaf | 6.2% | 6.1% | 6.4% | ||
Data Notes
Disability status is self-reported and not confirmed by a health-care provider; however, such self-reports have been shown to be acceptable for surveillance purposes. For purposes of this report, "disability" is defined as someone who said "yes" to one or more of the following questions:[[br]] 1. Are you blind or do you have serious difficulty seeing, even when wearing glasses?[[br]] 2. Because of a physical, mental, or emotional condition, do you have serious difficulty concentrating, remembering, or making decisions?[[br]] 3. Do you have serious difficulty walking or climbing stairs?[[br]] 4. Do you have difficulty dressing or bathing?[[br]] 5. Because of a physical, mental, or emotional condition, do you have any difficulty doing errands alone such as visiting a doctor's office or shopping?[[br]] 6. Are you deaf or do you have serious difficulty hearing?. [[br]] [[br]]Age-adjusted to U.S. 2000 standard population.Data Sources
- Utah Department of Health and Human Services Behavioral Risk Factor Surveillance System (BRFSS) [https://ibis.health.utah.gov/ibisph-view/query/selection/brfss/BRFSSSelection.html]
- Behavioral Risk Factor Surveillance System Survey Data, US Department of Health and Human Services Centers for Disease Control and Prevention (CDC).
References and Community Resources
^ ^ *NACCHO trainings and fact sheets, such as "Five Steps for Inclusive Communication: Engaging People with Disabilities" and "Health and Disability 101--Health Department Employee Training"([https://www.naccho.org/programs/community-health/disability]) *[https://livingwell.utah.gov/ Livingwell.utah.gov] lists Utah Department of Health evidence-based programs available in Utah communities. *GRAIDs: a framework for closing the gap in the availability of health promotion programs and interventions for people with disabilities. ([https://www.ncbi.nlm.nih.gov/pmc/articles/PMC4148531/])[[br]] *Responsive Practice: Providing Health Care & Screenings to Individuals with Disabilities training. ([https://unh.az1.qualtrics.com/jfe/form/SV_1B5WLVvguiDtBZ4?RID=MLRP_3fsn4HSwLlPf458&Q_CHL=email])[[br]] *Responsive Practice: Accessible and Adaptive Communication training. ([https://unh.az1.qualtrics.com/jfe/form/SV_3KH769aNL18oYXc?RID=MLRP_3fsn4HSwLlPf458&Q_CHL=email])[[br]] [[br]] 1. Centers for Disease Control and Prevention. National Center on Birth Defects and Developmental Disabilities. "Disability Impacts All of Us." [https://www.cdc.gov/ncbddd/disabilityandhealth/infographic-disability-impacts-all.html].[[br]] 2. Krahn G.H., Walker D.K., Correa-De-Araujo R. Persons with disabilities as an unrecognized health disparity population. AJPH. 2015;105:S198?S206. [https://www.ncbi.nlm.nih.gov/pmc/articles/PMC4355692/].[[br]] 3. Utah Department of Health and Human Services. Behavioral Risk Factor Surveillance System (BRFSS), Salt Lake City: Utah Department of Health, Center for Health Data.More Resources and Links
Evidence-based community health improvement ideas and interventions may be found at the following sites:- Centers for Disease Control and Prevention (CDC) WONDER Database, a system for disseminating public health data and information.
- United States Census Bureau data dashboard.
- Utah healthy Places Index, evidence-based and peer-reviewed tool, supports efforts to prioritize equitable community investments, develop critical programs and policies across the state, and much more.
- County Health Rankings
- Kaiser Family Foundation's StateHealthFacts.org
- Medical literature can be queried at PubMed library.
Page Content Updated On 01/10/2024,
Published on 03/19/2024

