Complete Health Indicator Report of Deaths due to Diabetes as Underlying Cause
Definition
Diabetes as the underlying cause of death refers to the first-listed cause of death with ICD-10 codes E10-E14 (diabetes mellitus).Numerator
Number of deaths with diabetes as the underlying cause of death.Denominator
Number of Utah residents.Why Is This Important?
Diabetes is a leading cause of disability and death. It is currently the eighth leading cause of death in the U.S.How Are We Doing?
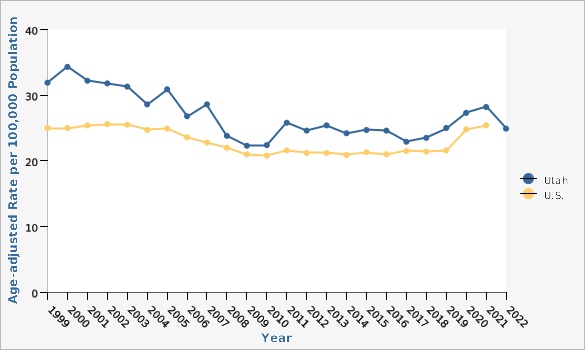
Utah death rates from diabetes were in decline from 1999 to 2008. From 2009 to 2017, death rates from diabetes remained relatively the same. However, since 2018 the death rates have been increasing slightly, with a drop in 2022.How Do We Compare With the U.S.?
Between 1999 and 2008, rates for diabetes deaths in Utah were consistently higher than those for the U.S. However, since 2008, Utah had similar death rates for diabetes compared to the U.S. But, in 2020, rates of diabetes deaths in Utah again were higher than those for the U.S. Age-adjusted rates are used in this indicator to account for the differences in age composition between the U.S. and Utah. In 2020, in the U.S., the age-adjusted rate was 24.8 per 100,000 population. For Utah in 2022 the rate was 24.9. 2020 is the most recent data available for U.S. deaths due to diabetes.What Is Being Done?
Diabetes care and education specialists play a prominent role in providing information about nutrition, exercise, and blood glucose monitoring. Diabetes education for all people with diabetes is encouraged to prevent complications and death from diabetes. The Healthy Environments Active Living ([https://heal.health.utah.gov/ HEAL]) Program promotes diabetes education throughout the state. The HEAL program is working statewide to increase the number of locations that offer Diabetes Self-Management Education and Support (DSMES) and also promote DSMES to eligible participants. The National Diabetes Prevention Program (National DPP) is also an evidence-based program to prevent type 2 diabetes, which would also contribute to reduced deaths from diabetes. The HEAL program works with statewide partners to promote the National DPP to eligible Utahns and also is working to expand National DPP sites across the state.Evidence-based Practices
Diabetes Self-Management Education and Support ([https://www.cdc.gov/diabetes/managing/education.html DSMES]) has been shown to improve blood glucose control in people with diabetes. Education programs may be recognized/accredited by the American Diabetes Association or the Association of Diabetes Care and Education Specialists. A list of DSMES programs available in Utah is available at [https://heal.health.utah.gov/dsmes-programs/].Available Services
The [https://dhhs.utah.gov/ Utah Department of Health and Human Services] has a Health Resource hotline: 1-888- 222-2542. Please call this number or 211 for information about self-management programs in Utah. The Healthy Environments Active Living ([https://heal.health.utah.gov/ HEAL]) website provides information on diabetes self-management classes. [https://diabetes.org/ American Diabetes Association] [[br]] 888-DIABETES [https://www.diabeteseducator.org/ Association of Diabetes Care & Education Specialists] [[br]] 800-338-3633 [https://www.heart.org/ American Heart Association] [[br]] 1937 S. 300 W. #120[[br]] Salt Lake City, UT 84115 [[br]] (801) 484-3838 or[[br]] 1-800-242-8721 Also see a list of [https://heal.health.utah.gov/dsmes-programs/ diabetes education classes in Utah], and a [https://heal.health.utah.gov/compass/#/?distance=30&programId=group_2 list of diabetes prevention classes in Utah].Health Program Information
Staff from the HEAL Program work with healthcare providers, including diabetes educators, dietitians, pharmacists, community health centers, community health workers, worksites, and health plans to improve the care provided to Utahns with diabetes. The Utah Department of Health and Human Services Healthy Environments Active Living program plays a key role in improving the health of residents in the state of Utah. The program was formed in July 2013 (as EPICC), through a new funding opportunity from the Centers of Disease Control and Prevention (CDC) that allowed for the merging of three previously existing programs: the Heart Disease and Stroke Prevention Program, the Diabetes Prevention and Control Program, and the Physical Activity, Nutrition and Obesity Program, as well as the addition of a school health program. The Healthy Environments Active Living Program (HEAL) was recently restructured as part of this strategic planning process and the new program model focuses on working together with staff and partners to address the social determinants of health while advancing health equity and increasing policy, systems and environment changes. HEAL champions public health initiatives and addresses the challenges of making health awareness and access truly universal and equitable in eight key areas: nutrition, heart health, diabetes, physical activity, schools, child care, community health workers, and worksites. Visit [https://heal.health.utah.gov/ HEAL's website] for more information.Related Indicators
Relevant Population Characteristics
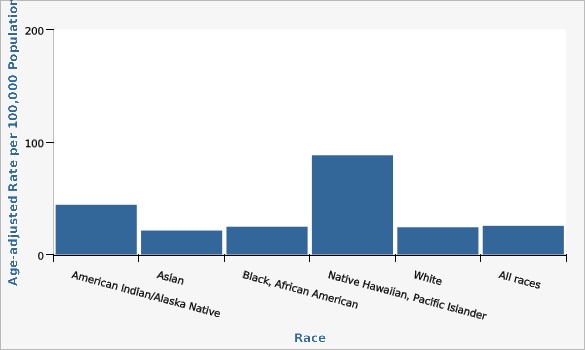
In 2022, diabetes was the eighth leading cause of death in Utah. People of minority races (particularly American Indian/Alaska Native and Native Hawaiian/Pacific Islander populations) had an increased risk of dying from diabetes.Related Relevant Population Characteristics Indicators:
- Utah Population Characteristics: Age Distribution of the Population
- Utah Population Characteristics: Education Level in the Population
- Utah Population Characteristics: Household Income
- Utah Health Improvement Index (HII)
- Utah Population Characteristics: Poverty, All Persons
- Utah Population Characteristics: Racial and Ethnic Composition of the Population
Health Care System Factors
Regular check-ups and laboratory exams are essential for detecting early signs of complications. With adequate preventive care and regular routine physician visits, some diabetes deaths could be prevented. Many diabetes-related problems, such as hypertension (high blood pressure) and early end-stage renal (kidney) disease, go undetected and are diagnosed only after serious complications have developed. This issue is particularly pronounced among people without insurance who often do not have the resources to seek regular, routine care for their diabetes.Related Health Care System Factors Indicators:
Risk Factors
Risk factors for diabetes include age, obesity, sedentary lifestyle, family history, hypertension, and dyslipidemia (including high blood cholesterol or triglycerides). The more risk factors a person has, the greater his or her chance of developing diabetes. Prediabetes is a condition in which a person's blood sugar levels are elevated but not quite high enough to meet the clinical threshold for diabetes. Unless steps are taken, most people with prediabetes will develop type 2 diabetes. Having had gestational diabetes during pregnancy is also a risk factor for developing type 2 diabetes.Related Risk Factors Indicators:
Health Status Outcomes
Uncontrolled diabetes can lead to debilitating health problems. People with diabetes have an excess risk for kidney failure, blindness, non- traumatic lower extremity amputations, and neuropathy (nerve damage). People with diabetes are more likely to report their health as "fair" or "poor" than people without diabetes.Related Health Status Outcomes Indicators:
Graphical Data Views
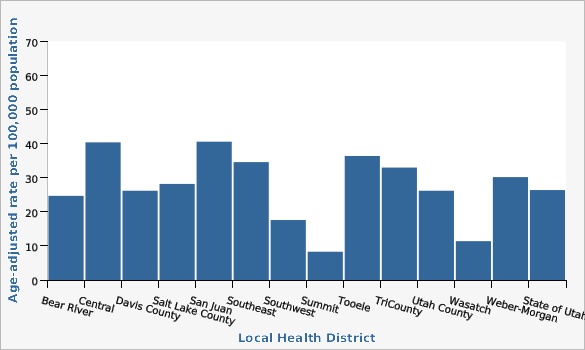
The estimates for the local health districts use four years of combined data so that reliable estimates could be obtained.
There was considerable variation in age-adjusted diabetes death rates by local health districts. Tooele, Central, and San Juan had the highest rates.
| Local Health District | Age-adjusted rate per 100,000 population | Lower Limit | Upper Limit | |||
|---|---|---|---|---|---|---|
Record Count: 14 | ||||||
| Bear River | 24.7 | 21.0 | 28.8 | |||
| Central | 40.4 | 34.1 | 47.4 | |||
| Davis County | 26.2 | 23.3 | 29.3 | |||
| Salt Lake County | 28.2 | 26.6 | 30.0 | |||
| San Juan | 40.6 | 25.7 | 61.0 | |||
| Southeast | 34.6 | 26.6 | 44.1 | |||
| Southwest | 17.6 | 15.5 | 19.9 | |||
| Summit | 8.3 | 4.5 | 14.1 | |||
| Tooele | 36.4 | 28.4 | 46.0 | |||
| TriCounty | 33.0 | 25.4 | 42.0 | |||
| Utah County | 26.2 | 23.8 | 28.9 | |||
| Wasatch | 11.4 | 6.3 | 19.1 | |||
| Weber-Morgan | 30.2 | 26.9 | 33.7 | |||
| State of Utah | 26.4 | 25.4 | 27.3 | |||
Data Notes
Age-adjusted to the 2000 U.S. standard population using 11 age groups.Data Sources
- Utah Death Certificate Database, Office of Vital Records and Statistics, Utah Department of Health and Human Services
- For years 2020 and later, the population estimates are provided by the Kem C. Gardner Policy Institute, Utah state and county annual population estimates are by single year of age and sex, IBIS Version 2022
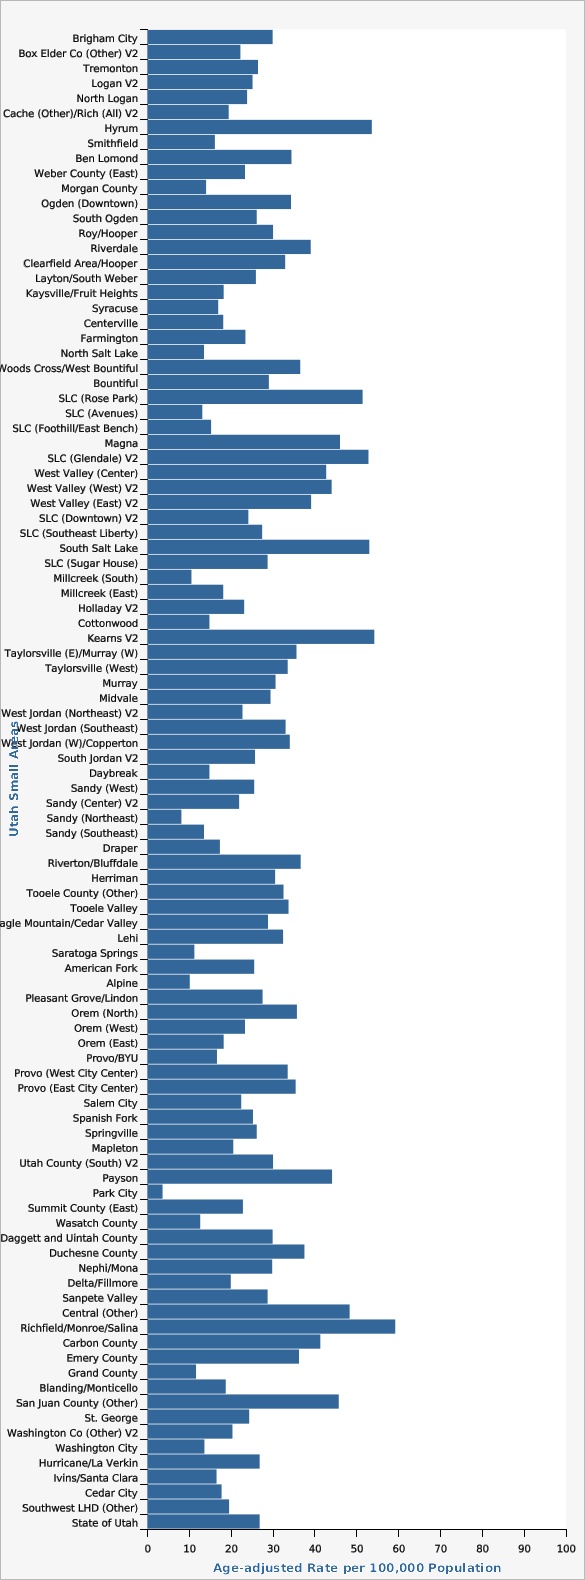
Because the number of deaths from diabetes within each small area is relatively small, this chart uses five years of death data to obtain reliable death rates. Still, a number of small areas (12) have estimates that do not meet DHHS standards for reliability.
| Utah Small Areas | Age-adjusted Rate per 100,000 Population | Lower Limit | Upper Limit | Note | ||
|---|---|---|---|---|---|---|
Record Count: 100 | ||||||
| Brigham City | 29.9 | 21.2 | 40.8 | |||
| Box Elder Co (Other) V2 | 22.2 | 11.9 | 37.7 | |||
| Tremonton | 26.4 | 16.0 | 40.9 | |||
| Logan V2 | 25.1 | 18.8 | 32.7 | |||
| North Logan | 23.8 | 14.7 | 36.5 | |||
| Cache (Other)/Rich (All) V2 | 19.4 | 11.9 | 30.0 | |||
| Hyrum | 53.6 | 28.0 | 92.9 | |||
| Smithfield | 16.1 | 7.3 | 31.0 | *Interpret with caution | ||
| Ben Lomond | 34.4 | 27.8 | 42.0 | |||
| Weber County (East) | 23.3 | 17.1 | 31.0 | |||
| Morgan County | 14.0 | 5.5 | 29.2 | *Interpret with caution | ||
| Ogden (Downtown) | 34.3 | 26.2 | 44.1 | |||
| South Ogden | 26.1 | 19.5 | 34.3 | |||
| Roy/Hooper | 30.0 | 23.1 | 38.4 | |||
| Riverdale | 39.0 | 29.4 | 50.6 | |||
| Clearfield Area/Hooper | 32.9 | 25.6 | 41.7 | |||
| Layton/South Weber | 25.9 | 20.7 | 32.0 | |||
| Kaysville/Fruit Heights | 18.2 | 12.0 | 26.5 | |||
| Syracuse | 16.9 | 8.9 | 29.3 | |||
| Centerville | 18.1 | 10.8 | 28.4 | |||
| Farmington | 23.4 | 13.7 | 37.2 | |||
| North Salt Lake | 13.5 | 6.9 | 23.6 | |||
| Woods Cross/West Bountiful | 36.5 | 19.5 | 62.2 | |||
| Bountiful | 29.0 | 23.1 | 35.9 | |||
| SLC (Rose Park) | 51.4 | 39.2 | 66.1 | |||
| SLC (Avenues) | 13.1 | 7.7 | 20.9 | |||
| SLC (Foothill/East Bench) | 15.2 | 9.4 | 23.1 | |||
| Magna | 46.0 | 32.5 | 63.2 | |||
| SLC (Glendale) V2 | 52.8 | 37.8 | 71.8 | |||
| West Valley (Center) | 42.7 | 33.7 | 53.3 | |||
| West Valley (West) V2 | 44.0 | 28.4 | 65.0 | |||
| West Valley (East) V2 | 39.1 | 30.6 | 49.2 | |||
| SLC (Downtown) V2 | 24.1 | 17.4 | 32.6 | |||
| SLC (Southeast Liberty) | 27.4 | 17.7 | 40.4 | |||
| South Salt Lake | 53.0 | 40.6 | 68.0 | |||
| SLC (Sugar House) | 28.7 | 21.8 | 37.2 | |||
| Millcreek (South) | 10.5 | 6.1 | 16.9 | |||
| Millcreek (East) | 18.1 | 12.0 | 26.4 | |||
| Holladay V2 | 23.1 | 16.6 | 31.1 | |||
| Cottonwood | 14.8 | 10.9 | 19.7 | |||
| Kearns V2 | 54.2 | 40.6 | 70.8 | |||
| Taylorsville (E)/Murray (W) | 35.6 | 27.3 | 45.5 | |||
| Taylorsville (West) | 33.5 | 25.1 | 43.9 | |||
| Murray | 30.6 | 23.2 | 39.6 | |||
| Midvale | 29.4 | 21.4 | 39.4 | |||
| West Jordan (Northeast) V2 | 22.7 | 14.9 | 33.2 | |||
| West Jordan (Southeast) | 33.0 | 23.1 | 45.6 | |||
| West Jordan (W)/Copperton | 34.0 | 20.6 | 52.7 | |||
| South Jordan V2 | 25.7 | 18.9 | 34.0 | |||
| Daybreak | 14.8 | 7.2 | 27.0 | |||
| Sandy (West) | 25.5 | 18.1 | 35.0 | |||
| Sandy (Center) V2 | 21.9 | 14.5 | 31.6 | |||
| Sandy (Northeast) | 8.1 | 4.0 | 14.8 | *Interpret with caution | ||
| Sandy (Southeast) | 13.5 | 7.6 | 22.1 | |||
| Draper | 17.3 | 10.4 | 27.1 | |||
| Riverton/Bluffdale | 36.6 | 26.9 | 48.6 | |||
| Herriman | 30.5 | 19.5 | 45.4 | |||
| Tooele County (Other) | 32.5 | 20.1 | 49.6 | |||
| Tooele Valley | 33.7 | 25.9 | 43.1 | |||
| Eagle Mountain/Cedar Valley | 28.8 | 14.9 | 50.2 | |||
| Lehi | 32.4 | 24.0 | 42.9 | |||
| Saratoga Springs | 11.2 | 4.1 | 24.7 | *Interpret with caution | ||
| American Fork | 25.5 | 18.6 | 34.1 | |||
| Alpine | 10.1 | 2.8 | 26.0 | *Interpret with caution | ||
| Pleasant Grove/Lindon | 27.5 | 20.4 | 36.3 | |||
| Orem (North) | 35.7 | 25.9 | 48.1 | |||
| Orem (West) | 23.3 | 16.2 | 32.4 | |||
| Orem (East) | 18.2 | 11.5 | 27.3 | |||
| Provo/BYU | 16.6 | 11.5 | 23.1 | |||
| Provo (West City Center) | 33.5 | 22.6 | 47.9 | |||
| Provo (East City Center) | 35.4 | 20.4 | 57.0 | |||
| Salem City | 22.4 | 10.6 | 41.7 | *Interpret with caution | ||
| Spanish Fork | 25.2 | 17.2 | 35.7 | |||
| Springville | 26.1 | 17.6 | 37.1 | |||
| Mapleton | 20.5 | 8.7 | 40.9 | *Interpret with caution | ||
| Utah County (South) V2 | 30.0 | 16.5 | 50.3 | |||
| Payson | 44.1 | 31.4 | 60.1 | |||
| Park City | 3.6 | 1.3 | 7.8 | *Interpret with caution | ||
| Summit County (East) | 22.8 | 11.8 | 39.9 | |||
| Wasatch County | 12.6 | 7.3 | 20.3 | |||
| Daggett and Uintah County | 29.9 | 21.9 | 40.1 | |||
| Duchesne County | 37.5 | 25.7 | 52.8 | |||
| Nephi/Mona | 29.8 | 14.7 | 53.8 | *Interpret with caution | ||
| Delta/Fillmore | 19.9 | 9.8 | 36.0 | *Interpret with caution | ||
| Sanpete Valley | 28.7 | 19.2 | 41.1 | |||
| Central (Other) | 48.3 | 37.5 | 61.1 | |||
| Richfield/Monroe/Salina | 59.2 | 44.3 | 77.5 | |||
| Carbon County | 41.3 | 30.3 | 55.0 | |||
| Emery County | 36.2 | 21.5 | 57.3 | |||
| Grand County | 11.6 | 4.9 | 23.3 | *Interpret with caution | ||
| Blanding/Monticello | 18.7 | 7.3 | 39.1 | *Interpret with caution | ||
| San Juan County (Other) | 45.7 | 26.1 | 74.2 | |||
| St. George | 24.3 | 20.5 | 28.5 | |||
| Washington Co (Other) V2 | 20.3 | 12.1 | 31.9 | |||
| Washington City | 13.6 | 8.2 | 21.0 | |||
| Hurricane/La Verkin | 26.8 | 19.0 | 36.7 | |||
| Ivins/Santa Clara | 16.5 | 9.8 | 26.0 | |||
| Cedar City | 17.7 | 12.5 | 24.2 | |||
| Southwest LHD (Other) | 19.5 | 13.5 | 27.3 | |||
| State of Utah | 26.8 | 25.9 | 27.7 | |||
Data Notes
Age-adjusted to the 2000 U.S. standard population using 11 age groups. *Unreliable Estimates: Use caution in interpreting; the estimate has a coefficient of variation >30% and is therefore deemed unreliable by Utah Department of Health and Human Services standards. A description of the Utah Small Areas may be found on the [https://ibis.health.utah.gov/resource/Guidelines.html Methodology and Guidelines page].Data Sources
- Utah Death Certificate Database, Office of Vital Records and Statistics, Utah Department of Health and Human Services
- Population estimates used linear interpolation of U.S. Census Bureau, Kem C. Gardner Policy Institute population estimates, and ESRI ZIP Code data provided annual population estimates for ZIP Code areas by sex and age groups, IBIS Version 2022
Diabetes death rates in Utah, in general, exceed U.S. diabetes death rates. Utah death rates from diabetes were in decline from 1999 to 2008. From 2009 to 2017 death rates from diabetes remained fairly constant. From 2018-2021 the death rates have been increasing slightly in Utah, with a drop in death rates in 2022.
| Utah vs. U.S. | Year | Age-adjusted Rate per 100,000 Population | Lower Limit | Upper Limit | ||
|---|---|---|---|---|---|---|
Record Count: 47 | ||||||
| Utah | 1999 | 31.9 | 29.0 | 34.9 | ||
| Utah | 2000 | 34.3 | 31.4 | 37.4 | ||
| Utah | 2001 | 32.2 | 29.4 | 35.1 | ||
| Utah | 2002 | 31.8 | 29.1 | 34.7 | ||
| Utah | 2003 | 31.3 | 28.6 | 34.1 | ||
| Utah | 2004 | 28.6 | 26.1 | 31.3 | ||
| Utah | 2005 | 30.9 | 28.3 | 33.6 | ||
| Utah | 2006 | 26.8 | 24.5 | 29.3 | ||
| Utah | 2007 | 28.6 | 26.2 | 31.1 | ||
| Utah | 2008 | 23.8 | 21.6 | 26.0 | ||
| Utah | 2009 | 22.3 | 20.3 | 24.5 | ||
| Utah | 2010 | 22.4 | 20.4 | 24.6 | ||
| Utah | 2011 | 25.8 | 23.7 | 28.0 | ||
| Utah | 2012 | 24.6 | 22.6 | 26.8 | ||
| Utah | 2013 | 25.4 | 23.4 | 27.6 | ||
| Utah | 2014 | 24.2 | 22.3 | 26.4 | ||
| Utah | 2015 | 24.7 | 22.8 | 26.8 | ||
| Utah | 2016 | 24.6 | 22.7 | 26.6 | ||
| Utah | 2017 | 22.9 | 21.1 | 24.8 | ||
| Utah | 2018 | 23.5 | 21.7 | 25.4 | ||
| Utah | 2019 | 25.0 | 23.1 | 26.9 | ||
| Utah | 2020 | 27.3 | 25.4 | 29.3 | ||
| Utah | 2021 | 28.2 | 26.3 | 30.2 | ||
| Utah | 2022 | 24.9 | 23.2 | 26.8 | ||
| U.S. | 1999 | 25.0 | 24.8 | 25.2 | ||
| U.S. | 2000 | 25.0 | 24.9 | 25.2 | ||
| U.S. | 2001 | 25.4 | 25.2 | 25.5 | ||
| U.S. | 2002 | 25.6 | 25.4 | 25.8 | ||
| U.S. | 2003 | 25.5 | 25.3 | 25.7 | ||
| U.S. | 2004 | 24.7 | 24.6 | 24.9 | ||
| U.S. | 2005 | 24.9 | 24.8 | 25.1 | ||
| U.S. | 2006 | 23.6 | 23.4 | 23.7 | ||
| U.S. | 2007 | 22.8 | 22.6 | 22.9 | ||
| U.S. | 2008 | 22.0 | 21.9 | 22.2 | ||
| U.S. | 2009 | 21.0 | 20.9 | 21.2 | ||
| U.S. | 2010 | 20.8 | 20.7 | 21.0 | ||
| U.S. | 2011 | 21.6 | 21.5 | 21.8 | ||
| U.S. | 2012 | 21.2 | 21.0 | 21.3 | ||
| U.S. | 2013 | 21.2 | 21.0 | 21.3 | ||
| U.S. | 2014 | 20.9 | 20.8 | 21.1 | ||
| U.S. | 2015 | 21.3 | 21.1 | 21.4 | ||
| U.S. | 2016 | 21.0 | 20.9 | 21.2 | ||
| U.S. | 2017 | 21.5 | 21.3 | 21.6 | ||
| U.S. | 2018 | 21.4 | 21.2 | 21.5 | ||
| U.S. | 2019 | 21.6 | 21.4 | 21.7 | ||
| U.S. | 2020 | 24.8 | 24.7 | 25.0 | ||
| U.S. | 2021 | 25.4 | 25.3 | 25.6 | ||
Data Notes
Age-adjusted to the 2000 U.S. standard population using 11 age groups.Data Sources
- Utah Death Certificate Database, Office of Vital Records and Statistics, Utah Department of Health and Human Services
- For years 2020 and later, the population estimates are provided by the Kem C. Gardner Policy Institute, Utah state and county annual population estimates are by single year of age and sex, IBIS Version 2022
- U.S. Underlying Cause of Death Data: WONDER Online Database. Centers for Disease Control and Prevention, National Center for Health Statistics. Accessed at [http://wonder.cdc.gov/ucd-icd10.html]
Pacific Islander Utahns had exceptionally high death rates due to diabetes.
| Race | Age-adjusted Rate per 100,000 Population | Lower Limit | Upper Limit | |||
|---|---|---|---|---|---|---|
Record Count: 6 | ||||||
| American Indian/Alaska Native | 44.2 | 29.5 | 63.8 | |||
| Asian | 21.3 | 14.6 | 30.0 | |||
| Black, African American | 24.7 | 13.3 | 41.9 | |||
| Native Hawaiian, Pacific Islander | 88.2 | 62.7 | 120.8 | |||
| White | 24.2 | 23.0 | 25.5 | |||
| All races | 25.5 | 24.3 | 26.8 | |||
Data Notes
All races may be of Hispanic/Latino or non-Hispanic/Latino ethnicity.[[br]] Data shown are for 2021-2022 (combined years) and age-adjusted to the 2000 U.S. standard population using 3 age groups.Data Sources
- Utah Death Certificate Database, Office of Vital Records and Statistics, Utah Department of Health and Human Services
- Population Estimates by Age, Sex, Race, and Hispanic Origin for Counties in Utah, U.S. Bureau of the Census, IBIS Version 2022
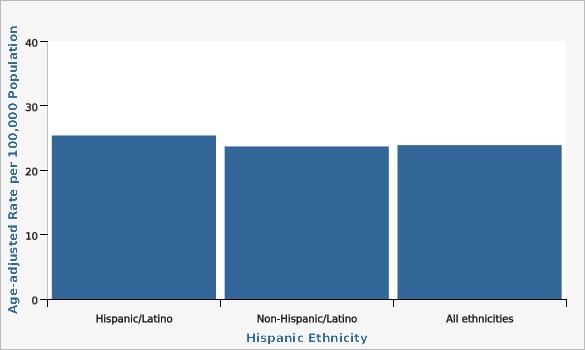
The diabetes death rate is statistically similar among Hispanic, non-Hispanic, and all adult Utahns.
| Hispanic Ethnicity | Age-adjusted Rate per 100,000 Population | Lower Limit | Upper Limit | |||
|---|---|---|---|---|---|---|
Record Count: 3 | ||||||
| Hispanic/Latino | 25.4 | 19.4 | 32.7 | |||
| Non-Hispanic/Latino | 23.7 | 21.9 | 25.5 | |||
| All ethnicities | 23.9 | 22.3 | 25.7 | |||
Data Notes
Age-adjusted to the 2000 U.S. population using 3 age groups.Data Sources
- Utah Death Certificate Database, Office of Vital Records and Statistics, Utah Department of Health and Human Services
- Population Estimates by Age, Sex, Race, and Hispanic Origin for Counties in Utah, U.S. Bureau of the Census, IBIS Version 2022
References and Community Resources
[https://diabetes.org/ American Diabetes Association] [https://www.cdc.gov/diabetes/index.html Division of Diabetes Translation], Centers for Disease Control and Prevention [https://wonder.cdc.gov/ CDC Wonder] Association of Diabetes Care & Education Specialists [http://www.diabeteseducator.org]More Resources and Links
Evidence-based community health improvement ideas and interventions may be found at the following sites:- Centers for Disease Control and Prevention (CDC) WONDER Database, a system for disseminating public health data and information.
- United States Census Bureau data dashboard.
- Utah healthy Places Index, evidence-based and peer-reviewed tool, supports efforts to prioritize equitable community investments, develop critical programs and policies across the state, and much more.
- County Health Rankings
- Kaiser Family Foundation's StateHealthFacts.org
- Medical literature can be queried at PubMed library.
Page Content Updated On 03/06/2024,
Published on 03/27/2024

