Complete Health Indicator Report of Overweight or Obese
Definition
The proportion of persons age 18 years and older who have a body mass index (BMI) greater than or equal to 25.0 kg/m^2^ calculated from self-reported weight and height.Numerator
The number of respondents age 18 years and older who have a body mass index (BMI) greater than or equal to 25.0 kg/m^2^ calculated from self-reported weight and height.Denominator
The number of respondents age 18 years and older for whom BMI can be calculated from their self-reported weight and height (excludes unknowns or refusals for weight and height).Data Interpretation Issues
To reduce bias and more accurately represent population data, the BRFSS has changed survey methodology. In 2010, it began conducting surveys by cellular phone in addition to landline phones. It also adopted "iterative proportional fitting" (raking) as its weighting method. More details about these changes can be found at: [https://ibis.health.utah.gov/pdf/opha/resource/brfss/RakingImpact2011.pdf]. Most of the rates shown are age-adjusted. Age-adjusting allows the prevalence of a disease or condtion in different populations to be compared as though both populations had the same age distribution.Why Is This Important?
Being overweight increases the risk of many chronic diseases, including heart disease, stroke, hypertension, type 2 diabetes, osteoarthritis, and some cancers. Most of the estimates shown in the graphs for this indicator use age-adjusted rates. The age-adjusted rate for 2021 was (65.5%; CI 64.3%--66.7%) for Utah adults. The crude rate in 2021 indicate that more than sixty percent of Utah adults (64.2%; 62.9%-65.5%) were overweight or obese.Healthy People Objective NWS-8:
Increase the proportion of adults who are at a healthy weightU.S. Target: 33.9 percent
How Are We Doing?
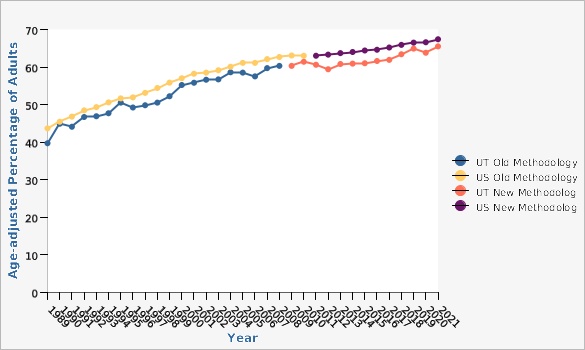
The percentage of adults who were overweight or obese increased steadily over the past decades. In Utah, the age-adjusted percentage of overweight or obese individuals increased from 39.7% in 1989 to 65.5% in 2021 (age-adjusted).How Do We Compare With the U.S.?
The percentage of Utah adults who are overweight or obese is slightly lower than the percentage of U.S. adults (Utah 65.5% vs. 67.4%, age-adjusted percentages).What Is Being Done?
The Utah Department of Health and Human Service's Healthy Environments Active Living (HEAL) Program plays a key role in improving the health of residents in the state of Utah. The program was formed in July 2013 (as Healthy Living through Environment, Policy, and Improved Clinical Care: EPICC), through a new funding opportunity from the Centers of Disease Control and Prevention (CDC) that allowed for the merging of three previously existing programs: the Heart Disease and Stroke Prevention Program, the Diabetes Prevention and Control Program, and the Physical Activity, Nutrition and Obesity Program, as well as the addition of a school health program. HEAL was recently restructured as part of a strategic planning process and the new program model focuses on staff and partners working together to address the social determinants of health while advancing health equity and increasing policy, systems and environmental changes. HEAL works: In schools:[[br]] HEAL encourages schools to adopt the Comprehensive School Physical Activity Program. This framework encourages students to be physically active for 60 minutes a day through school, home, and community activities. HEAL also tracks height and weight trends in elementary school students. In worksites:[[br]] HEAL offers training on developing worksite wellness programs called Work@Health. HEAL partners with local health departments to encourage worksites to complete the CDC Scorecard and participate in yearly health risk assessments for their employees. HEAL provides toolkits and other resources for employers interested in implementing wellness programs [https://heal.health.utah.gov/worksite-wellness]. In communities:[[br]] HEAL receives federal funding to partner with worksites and community-based organizations to increase access to fresh fruits and vegetables in worksite and community settings. HEAlL also partners with LHDs to work with cities and/or counties within their jurisdictions to create a built environment that encourages physical activity. In healthcare:[[br]] HEAL works with health care systems to establish community clinical linkages to support individuals at risk for or diagnosed with diabetes or hypertension to engage in lifestyle change programs such as chronic disease self-management and diabetes prevention programs. In childcare:[[br]] HEAL works with state and local partners through the Childcare Obesity Prevention workgroup to implement policy and systems changes in early care and education across agencies statewide. Ten local health departments statewide have implemented the TOP Star program, which aims to improve the nutrition, physical activity, and breastfeeding policies and environments and achieve best practices in childcare centers and homes.[[br]]Available Services
Please see the website for the Healthy Enviornments Active Living (HEAL) program, located under the Utah Department of Health and Human Services: [https://heal.health.utah.gov]Health Program Information
Overarching Goals: Healthy People: Increase access to resources that empower all people in Utah to reach their full health potential. Healthy Communities: Increase the capacity of communities to support and promote healthy living for all individuals. Equitable Society: Increase opportunities for people who are under-resourced and under-represented in Utah to live healthy and thriving lives.Related Indicators
Relevant Population Characteristics
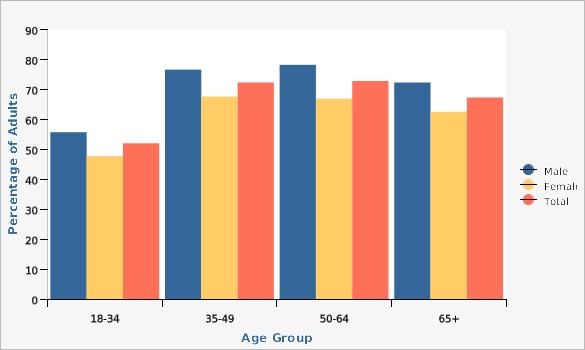
Males generally have higher rates of obesity than females across every age group. Utah adults who are American Indian/Native American or Native Hawaiian/Pacific Islander tend to have higher rates of overweight/obesity. For a comprehensive view of national data on relevant population characteristics, see [https://www.cdc.gov/nchs/data/databriefs/db360-h.pdf].Related Relevant Population Characteristics Indicators:
Related Health Care System Factors Indicators:
Risk Factors
Behaviors such as engaging in physical activity and having a healthy diet, can have a significant impact on reducing the risk of being overweight or obese. Addressing social determinants of health can also have a great impact on reducing the risk of obesity and obesity-related disparities.Related Risk Factors Indicators:
Health Status Outcomes
Being overweight or obese can increase the risk of many related health conditions, such as diabetes, high blood pressure, and liver disease.Related Health Status Outcomes Indicators:
Graphical Data Views
In 2021, the overweight or obesity rate in Utah continued to be slightly lower than the U.S. rate, 65.5% vs. 67.4%, respecitvely.
| BRFSS Utah vs. U.S. | Year | Age-adjusted Percentage of Adults | Lower Limit | Upper Limit | ||
|---|---|---|---|---|---|---|
Record Count: 66 | ||||||
| UT Old Methodology | 1989 | 39.7% | 37.2% | 42.2% | ||
| UT Old Methodology | 1990 | 44.9% | 42.4% | 47.4% | ||
| UT Old Methodology | 1991 | 44.1% | 41.5% | 46.7% | ||
| UT Old Methodology | 1992 | 46.7% | 44.2% | 49.3% | ||
| UT Old Methodology | 1993 | 46.9% | 44.4% | 49.4% | ||
| UT Old Methodology | 1994 | 47.7% | 45.2% | 50.2% | ||
| UT Old Methodology | 1995 | 50.5% | 48.2% | 52.8% | ||
| UT Old Methodology | 1996 | 49.2% | 46.9% | 51.5% | ||
| UT Old Methodology | 1997 | 49.8% | 47.4% | 52.1% | ||
| UT Old Methodology | 1998 | 50.5% | 48.1% | 52.9% | ||
| UT Old Methodology | 1999 | 52.2% | 49.8% | 54.5% | ||
| UT Old Methodology | 2000 | 55.2% | 52.9% | 57.6% | ||
| UT Old Methodology | 2001 | 55.8% | 53.7% | 57.8% | ||
| UT Old Methodology | 2002 | 56.6% | 54.6% | 58.6% | ||
| UT Old Methodology | 2003 | 56.7% | 54.7% | 58.7% | ||
| UT Old Methodology | 2004 | 58.6% | 56.9% | 60.2% | ||
| UT Old Methodology | 2005 | 58.5% | 56.8% | 60.1% | ||
| UT Old Methodology | 2006 | 57.5% | 55.8% | 59.2% | ||
| UT Old Methodology | 2007 | 59.7% | 57.9% | 61.5% | ||
| UT Old Methodology | 2008 | 60.3% | 58.6% | 62.0% | ||
| US Old Methodology | 1989 | 43.7% | 43.1% | 44.3% | ||
| US Old Methodology | 1990 | 45.4% | 44.9% | 46.0% | ||
| US Old Methodology | 1991 | 46.8% | 46.3% | 47.3% | ||
| US Old Methodology | 1992 | 48.4% | 48.0% | 48.9% | ||
| US Old Methodology | 1993 | 49.3% | 48.9% | 49.8% | ||
| US Old Methodology | 1994 | 50.6% | 50.1% | 51.1% | ||
| US Old Methodology | 1995 | 51.6% | 51.1% | 52.1% | ||
| US Old Methodology | 1996 | 51.9% | 51.5% | 52.4% | ||
| US Old Methodology | 1997 | 53.1% | 52.7% | 53.5% | ||
| US Old Methodology | 1998 | 54.4% | 54.0% | 54.8% | ||
| US Old Methodology | 1999 | 55.8% | 55.4% | 56.3% | ||
| US Old Methodology | 2000 | 57.0% | 56.6% | 57.4% | ||
| US Old Methodology | 2001 | 58.2% | 57.8% | 58.6% | ||
| US Old Methodology | 2002 | 58.5% | 58.2% | 58.9% | ||
| US Old Methodology | 2003 | 59.1% | 58.8% | 59.5% | ||
| US Old Methodology | 2004 | 60.1% | 59.7% | 60.4% | ||
| US Old Methodology | 2005 | 61.1% | 60.7% | 61.4% | ||
| US Old Methodology | 2006 | 61.1% | 60.7% | 61.4% | ||
| US Old Methodology | 2007 | 62.1% | 61.8% | 62.5% | ||
| US Old Methodology | 2008 | 62.7% | 62.4% | 63.0% | ||
| US Old Methodology | 2009 | 63.1% | 62.8% | 63.4% | ||
| US Old Methodology | 2010 | 63.0% | 62.7% | 63.3% | ||
| UT New Methodology | 2009 | 60.3% | 59.1% | 61.5% | ||
| UT New Methodology | 2010 | 61.4% | 60.3% | 62.5% | ||
| UT New Methodology | 2011 | 60.6% | 59.5% | 61.7% | ||
| UT New Methodology | 2012 | 59.4% | 58.2% | 60.5% | ||
| UT New Methodology | 2013 | 60.8% | 59.7% | 61.9% | ||
| UT New Methodology | 2014 | 60.9% | 59.9% | 61.8% | ||
| UT New Methodology | 2015 | 61.0% | 59.8% | 62.1% | ||
| UT New Methodology | 2016 | 61.6% | 60.3% | 62.9% | ||
| UT New Methodology | 2017 | 61.9% | 60.7% | 63.1% | ||
| UT New Methodology | 2018 | 63.4% | 62.2% | 64.6% | ||
| UT New Methodology | 2019 | 64.9% | 63.7% | 65.9% | ||
| UT New Methodology | 2020 | 63.8% | 62.7% | 65.0% | ||
| UT New Methodology | 2021 | 65.5% | 64.3% | 66.7% | ||
| US New Methodology | 2011 | 63.0% | 62.7% | 63.3% | ||
| US New Methodology | 2012 | 63.3% | 63.0% | 63.6% | ||
| US New Methodology | 2013 | 63.7% | 63.4% | 64.0% | ||
| US New Methodology | 2014 | 64.0% | 63.7% | 64.3% | ||
| US New Methodology | 2015 | 64.4% | 64.1% | 64.7% | ||
| US New Methodology | 2016 | 64.6% | 64.3% | 64.9% | ||
| US New Methodology | 2017 | 65.2% | 64.9% | 65.5% | ||
| US New Methodology | 2018 | 65.9% | 65.5% | 66.2% | ||
| US New Methodology | 2019 | 66.5% | 66.2% | 66.8% | ||
| US New Methodology | 2020 | 66.6% | 66.2% | 67.0% | ||
| US New Methodology | 2021 | 67.4% | 67.0% | 67.7% | ||
Data Notes
Overweight or obese is defined as a BMI of 25 or more. BMI is calculated by dividing weight in kilograms by the square of height in meters. [[br]] [[br]]The U.S./Utah graphs includes estimates using old and new methodologies. In 2011, the BRFSS changed its methodology from a landline only sample and weighting based on post-stratification to a landline/cell phone sample and raking as the weighting methodology. Raking accounts for variables such as income, education, marital status, and home ownership during weighting and has the potential to more accurately reflect the population distribution. [[br]] [[br]] In 2016, Utah BRFSS modified its methodology for age adjustment for increased precision. With this change Utah is consistent with both the U.S. and other states using IBIS. Data has been updated from 2011 onward in all chart views to reflect this change. [[br]] Age-adjusted to U.S. 2000 standard population. [[br]] [[br]]Data Sources
- The Utah Department of Health and Human Services Behavioral Risk Factor Surveillance System (BRFSS)
- Behavioral Risk Factor Surveillance System Survey Data, US Department of Health and Human Services Centers for Disease Control and Prevention (CDC).
Males have higher rates of overweight/obesity across every age group.
| Males vs. Females | Age Group | Percentage of Adults | Lower Limit | Upper Limit | ||
|---|---|---|---|---|---|---|
Record Count: 12 | ||||||
| Male | 18-34 | 55.7% | 52.3% | 59.0% | ||
| Male | 35-49 | 76.6% | 73.6% | 79.4% | ||
| Male | 50-64 | 78.2% | 75.0% | 81.0% | ||
| Male | 65+ | 72.3% | 69.0% | 75.4% | ||
| Female | 18-34 | 47.7% | 43.9% | 51.6% | ||
| Female | 35-49 | 67.6% | 64.3% | 70.7% | ||
| Female | 50-64 | 66.9% | 63.3% | 70.3% | ||
| Female | 65+ | 62.5% | 59.2% | 65.7% | ||
| Total | 18-34 | 52.0% | 49.4% | 54.5% | ||
| Total | 35-49 | 72.3% | 70.1% | 74.4% | ||
| Total | 50-64 | 72.8% | 70.4% | 75.0% | ||
| Total | 65+ | 67.3% | 65.0% | 69.5% | ||
Data Notes
Overweight or obese is defined as a BMI of 25 or more. BMI is calculated by dividing weight in kilograms by the square of height in meters. [[br]] [[br]] This graph uses "crude" rates, i.e., these values are not adjusted for age.Data Source
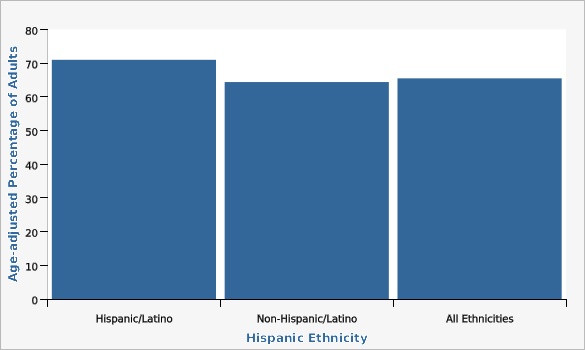
The Utah Department of Health and Human Services Behavioral Risk Factor Surveillance System (BRFSS)Hispanic adults have higher rates of overweight or obesity than non-Hispanics adults.
| Hispanic Ethnicity | Age-adjusted Percentage of Adults | Lower Limit | Upper Limit | |||
|---|---|---|---|---|---|---|
Record Count: 3 | ||||||
| Hispanic/Latino | 71.0% | 66.9% | 74.7% | |||
| Non-Hispanic/Latino | 64.4% | 63.1% | 65.7% | |||
| All Ethnicities | 65.5% | 64.3% | 66.7% | |||
Data Notes
Overweight or obese is defined as a BMI of 25 or more. BMI is calculated by dividing weight in kilograms by the square of height in meters. [[br]] [[br]] Age-adjusted to U.S. 2000 standard population.Data Source
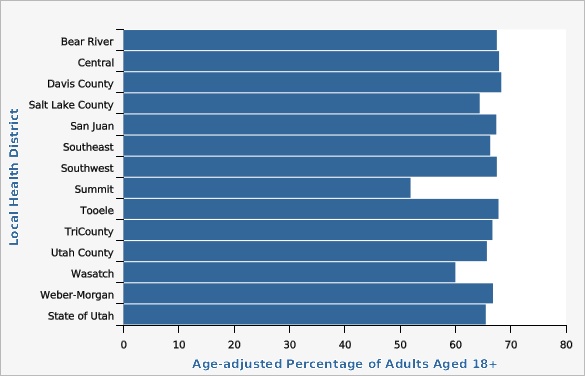
The Utah Department of Health and Human Services Behavioral Risk Factor Surveillance System (BRFSS)Among local health districts, Summit County has the lowest rate of overweight/obesity among adults.
| Local Health District | Age-adjusted Percentage of Adults Aged 18+ | Lower Limit | Upper Limit | Note | ||
|---|---|---|---|---|---|---|
Record Count: 14 | ||||||
| Bear River | 67.5% | 62.5% | 72.1% | |||
| Central | 67.9% | 62.1% | 73.2% | |||
| Davis County | 68.3% | 64.2% | 72.2% | |||
| Salt Lake County | 64.4% | 62.3% | 66.4% | |||
| San Juan | 67.4% | 56.9% | 76.4% | |||
| Southeast | 66.3% | 57.5% | 74.1% | |||
| Southwest | 67.5% | 62.4% | 72.2% | |||
| Summit | 51.9% | 43.3% | 60.4% | Lower than the state | ||
| Tooele | 67.8% | 61.0% | 73.9% | |||
| TriCounty | 66.7% | 61.6% | 71.4% | |||
| Utah County | 65.7% | 63.2% | 68.1% | |||
| Wasatch | 60.0% | 50.9% | 68.3% | |||
| Weber-Morgan | 66.8% | 62.5% | 70.8% | |||
| State of Utah | 65.5% | 64.3% | 66.7% | |||
Data Notes
Overweight or obese is defined as a BMI of 25 or more. BMI is calculated by dividing weight in kilograms by the square of height in meters. [[br]] [[br]] Percentages have been age-adjusted to the U.S. 2000 standard population.Data Sources
- The Utah Department of Health and Human Services Behavioral Risk Factor Surveillance System (BRFSS)
- Behavioral Risk Factor Surveillance System Survey Data, US Department of Health and Human Services Centers for Disease Control and Prevention (CDC).
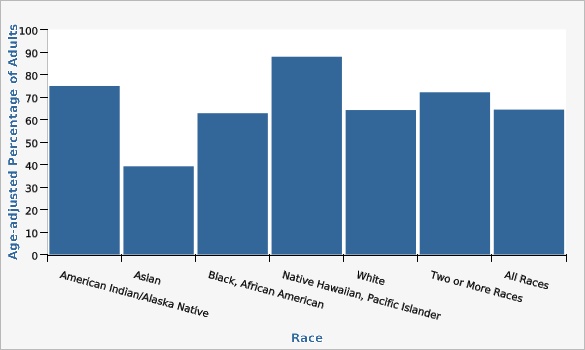
Two years of data are combined for this measure to increase the reliability of the estimates. Overweight/obesity rate is highest for Pacific Islander adults in comparison with all other race groups. Asian adults have the lowest rate of overweight/obesity.
| Race | Age-adjusted Percentage of Adults | Lower Limit | Upper Limit | |||
|---|---|---|---|---|---|---|
Record Count: 7 | ||||||
| American Indian/Alaska Native | 74.9% | 68.8% | 80.2% | |||
| Asian | 39.2% | 32.5% | 46.3% | |||
| Black, African American | 62.8% | 54.5% | 70.5% | |||
| Native Hawaiian, Pacific Islander | 87.9% | 78.9% | 93.4% | |||
| White | 64.2% | 63.3% | 65.1% | |||
| Two or More Races | 72.1% | 68.3% | 75.7% | |||
| All Races | 64.4% | 63.6% | 65.3% | |||
Data Notes
Overweight or obese is defined as a BMI of 25 or more. BMI is calculated by dividing weight in kilograms by the square of height in meters. [[br]] [[br]] Age-adjusted to U.S. 2000 standard population based on 3 age groups: 18-34, 35-49, and 50+.Data Source
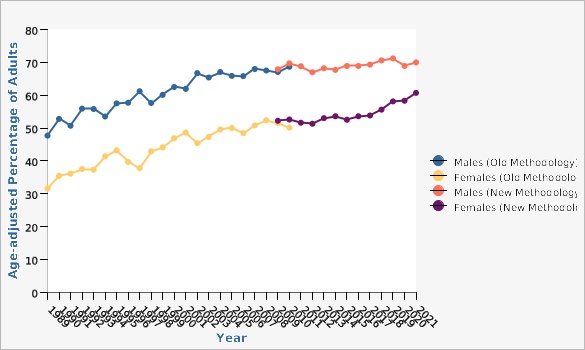
The Utah Department of Health and Human Services Behavioral Risk Factor Surveillance System (BRFSS)Males have consistently higher rates over time of overweight/obesity than females. Rates are age-adjusted.
| Males vs. Females (BRFSS Old vs. New Methodology) | Year | Age-adjusted Percentage of Adults | Lower Limit | Upper Limit | ||
|---|---|---|---|---|---|---|
Record Count: 70 | ||||||
| Males (Old Methodology) | 1989 | 47.7% | 43.9% | 51.5% | ||
| Males (Old Methodology) | 1990 | 52.8% | 49.1% | 56.4% | ||
| Males (Old Methodology) | 1991 | 50.7% | 47.0% | 54.4% | ||
| Males (Old Methodology) | 1992 | 55.9% | 52.0% | 59.7% | ||
| Males (Old Methodology) | 1993 | 55.8% | 52.1% | 59.6% | ||
| Males (Old Methodology) | 1994 | 53.5% | 49.8% | 57.2% | ||
| Males (Old Methodology) | 1995 | 57.5% | 54.0% | 60.9% | ||
| Males (Old Methodology) | 1996 | 57.7% | 54.4% | 60.9% | ||
| Males (Old Methodology) | 1997 | 61.2% | 58.0% | 64.5% | ||
| Males (Old Methodology) | 1998 | 57.6% | 53.9% | 61.2% | ||
| Males (Old Methodology) | 1999 | 60.1% | 56.6% | 63.5% | ||
| Males (Old Methodology) | 2000 | 62.5% | 59.2% | 65.7% | ||
| Males (Old Methodology) | 2001 | 61.9% | 59.0% | 64.9% | ||
| Males (Old Methodology) | 2002 | 66.7% | 64.0% | 69.5% | ||
| Males (Old Methodology) | 2003 | 65.4% | 62.5% | 68.3% | ||
| Males (Old Methodology) | 2004 | 67.0% | 64.8% | 69.3% | ||
| Males (Old Methodology) | 2005 | 65.9% | 63.4% | 68.2% | ||
| Males (Old Methodology) | 2006 | 65.8% | 63.4% | 68.2% | ||
| Males (Old Methodology) | 2007 | 68.0% | 65.4% | 70.5% | ||
| Males (Old Methodology) | 2008 | 67.5% | 65.2% | 69.7% | ||
| Males (Old Methodology) | 2009 | 67.0% | 65.2% | 68.8% | ||
| Males (Old Methodology) | 2010 | 68.7% | 66.8% | 70.4% | ||
| Females (Old Methodology) | 1989 | 31.6% | 28.4% | 34.7% | ||
| Females (Old Methodology) | 1990 | 35.4% | 32.2% | 38.7% | ||
| Females (Old Methodology) | 1991 | 36.1% | 32.8% | 39.4% | ||
| Females (Old Methodology) | 1992 | 37.5% | 34.2% | 40.8% | ||
| Females (Old Methodology) | 1993 | 37.3% | 33.9% | 40.7% | ||
| Females (Old Methodology) | 1994 | 41.4% | 38.0% | 44.8% | ||
| Females (Old Methodology) | 1995 | 43.2% | 40.2% | 46.2% | ||
| Females (Old Methodology) | 1996 | 39.7% | 36.6% | 42.7% | ||
| Females (Old Methodology) | 1997 | 37.8% | 34.7% | 41.0% | ||
| Females (Old Methodology) | 1998 | 42.9% | 39.7% | 46.1% | ||
| Females (Old Methodology) | 1999 | 44.1% | 40.9% | 47.2% | ||
| Females (Old Methodology) | 2000 | 46.9% | 43.7% | 50.1% | ||
| Females (Old Methodology) | 2001 | 48.6% | 45.7% | 51.4% | ||
| Females (Old Methodology) | 2002 | 45.4% | 42.8% | 48.1% | ||
| Females (Old Methodology) | 2003 | 47.3% | 44.6% | 50.0% | ||
| Females (Old Methodology) | 2004 | 49.5% | 47.2% | 51.9% | ||
| Females (Old Methodology) | 2005 | 50.0% | 47.9% | 52.2% | ||
| Females (Old Methodology) | 2006 | 48.4% | 46.2% | 50.7% | ||
| Females (Old Methodology) | 2007 | 50.8% | 48.4% | 53.1% | ||
| Females (Old Methodology) | 2008 | 52.4% | 50.0% | 54.8% | ||
| Females (Old Methodology) | 2009 | 51.5% | 49.7% | 53.3% | ||
| Females (Old Methodology) | 2010 | 50.1% | 48.4% | 51.8% | ||
| Males (New Methodology) | 2009 | 67.9% | 66.2% | 69.6% | ||
| Males (New Methodology) | 2010 | 69.7% | 68.2% | 71.1% | ||
| Males (New Methodology) | 2011 | 68.8% | 67.3% | 70.4% | ||
| Males (New Methodology) | 2012 | 67.0% | 65.4% | 68.5% | ||
| Males (New Methodology) | 2013 | 68.2% | 66.7% | 69.6% | ||
| Males (New Methodology) | 2014 | 67.7% | 66.4% | 68.9% | ||
| Males (New Methodology) | 2015 | 68.9% | 67.4% | 70.4% | ||
| Males (New Methodology) | 2016 | 68.9% | 67.2% | 70.6% | ||
| Males (New Methodology) | 2017 | 69.3% | 67.7% | 70.9% | ||
| Males (New Methodology) | 2018 | 70.6% | 69.1% | 72.1% | ||
| Males (New Methodology) | 2019 | 71.2% | 69.7% | 72.6% | ||
| Males (New Methodology) | 2020 | 68.9% | 67.4% | 70.4% | ||
| Males (New Methodology) | 2021 | 70.0% | 68.4% | 71.5% | ||
| Females (New Methodology) | 2009 | 52.2% | 50.6% | 53.9% | ||
| Females (New Methodology) | 2010 | 52.6% | 51.1% | 54.1% | ||
| Females (New Methodology) | 2011 | 51.6% | 50.1% | 53.2% | ||
| Females (New Methodology) | 2012 | 51.3% | 49.7% | 52.8% | ||
| Females (New Methodology) | 2013 | 53.0% | 51.4% | 54.5% | ||
| Females (New Methodology) | 2014 | 53.6% | 52.2% | 55.0% | ||
| Females (New Methodology) | 2015 | 52.5% | 50.8% | 54.1% | ||
| Females (New Methodology) | 2016 | 53.6% | 51.7% | 55.5% | ||
| Females (New Methodology) | 2017 | 53.8% | 52.0% | 55.6% | ||
| Females (New Methodology) | 2018 | 55.6% | 53.8% | 57.3% | ||
| Females (New Methodology) | 2019 | 58.1% | 56.4% | 59.8% | ||
| Females (New Methodology) | 2020 | 58.3% | 56.5% | 60.1% | ||
| Females (New Methodology) | 2021 | 60.7% | 58.9% | 62.4% | ||
Data Notes
Overweight or obese is defined as a BMI of 25 or more. BMI is calculated by dividing weight in kilograms by the square of height in meters. [[br]] [[br]] Age-adjusted to U.S. 2000 population.Data Source
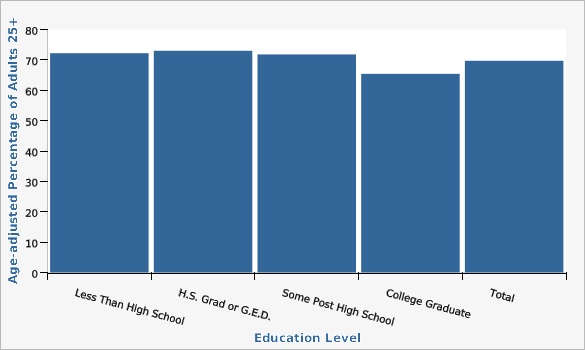
The Utah Department of Health and Human Services Behavioral Risk Factor Surveillance System (BRFSS)This view is for adults aged 25 and older.. Data show little difference in overweight or obesity rates by education. Utah adults with at least a college degree have the lowest rate of overweight/obesity.
| Education Level | Age-adjusted Percentage of Adults 25+ | Lower Limit | Upper Limit | |||
|---|---|---|---|---|---|---|
Record Count: 5 | ||||||
| Less Than High School | 72.2% | 66.2% | 77.5% | |||
| H.S. Grad or G.E.D. | 73.0% | 70.4% | 75.5% | |||
| Some Post High School | 71.8% | 69.6% | 73.9% | |||
| College Graduate | 65.4% | 63.5% | 67.2% | |||
| Total | 69.7% | 68.5% | 71.0% | |||
Data Notes
Overweight or obese is defined as a BMI of 25 or more. BMI is calculated by dividing weight in kilograms by the square of height in meters. [[br]] [[br]] Age-adjusted to U.S. 2000 standard population.This view is for aduls 25 and over.Data Source
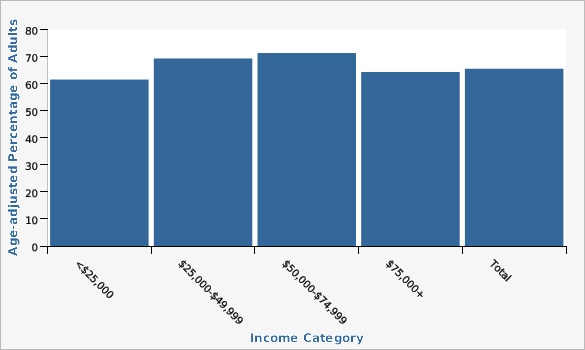
The Utah Department of Health and Human Services Behavioral Risk Factor Surveillance System (BRFSS)There is little variation in the rates of overweightobesity by income. Higher rates of obesity are seen for adults with incomes incomes between $25,000 and $74,999.
| Income Category | Age-adjusted Percentage of Adults | Lower Limit | Upper Limit | |||
|---|---|---|---|---|---|---|
Record Count: 5 | ||||||
| <$25,000 | 61.5% | 56.9% | 65.9% | |||
| $25,000-$49,999 | 69.3% | 66.6% | 72.0% | |||
| $50,000-$74,999 | 71.3% | 68.2% | 74.2% | |||
| $75,000+ | 64.3% | 62.3% | 66.3% | |||
| Total | 65.5% | 64.3% | 66.7% | |||
Data Notes
Overweight or obese is defined as a BMI of 25 or more. BMI is calculated by dividing weight in kilograms by the square of height in meters. [[br]] [[br]] Age-adjusted to U.S. 2000 standard population.Data Source
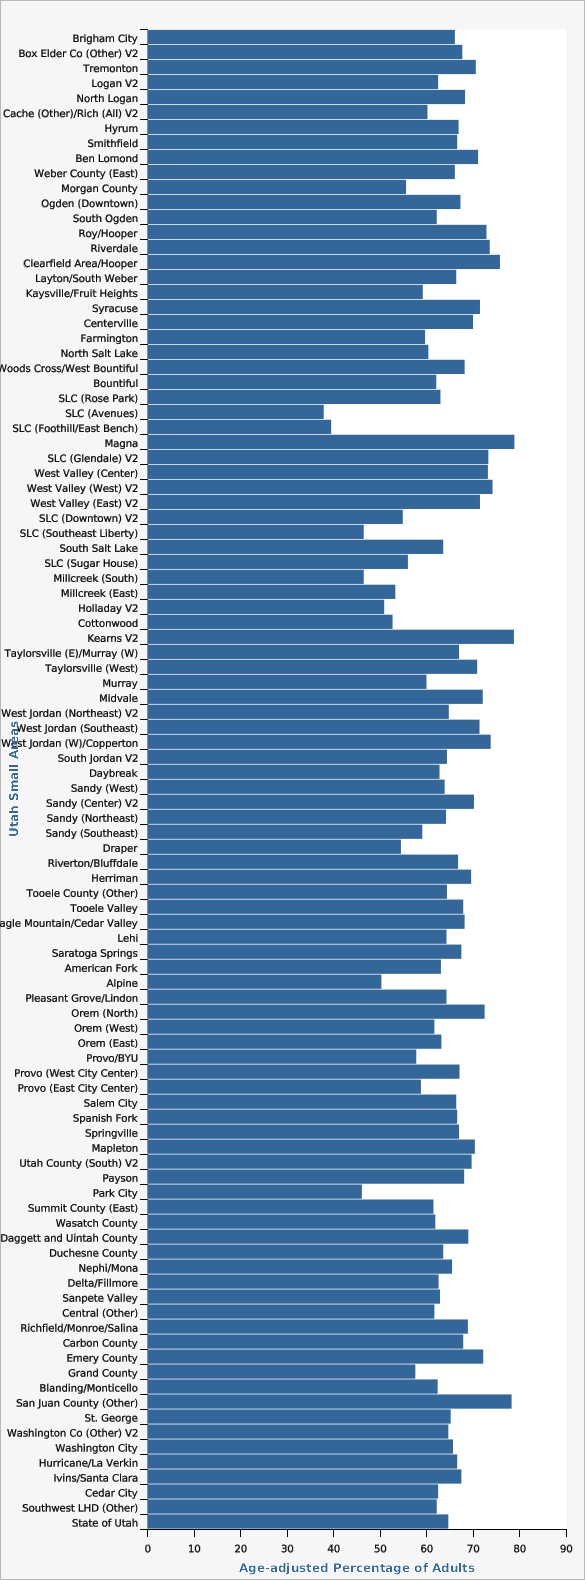
The Utah Department of Health and Human Services Behavioral Risk Factor Surveillance System (BRFSS)For combined years 2019-2021, the small area Salt Lake City (Avenues) had the lowest rate of overweight/obesity. Highest rates were seen for small areas Kearns V2, Magna. and San Juan Couinty (Other).
| Utah Small Areas | Age-adjusted Percentage of Adults | Lower Limit | Upper Limit | Note | ||
|---|---|---|---|---|---|---|
Record Count: 100 | ||||||
| Brigham City | 66.1% | 58.0% | 73.2% | |||
| Box Elder Co (Other) V2 | 67.7% | 58.8% | 75.4% | |||
| Tremonton | 70.6% | 61.0% | 78.6% | |||
| Logan V2 | 62.5% | 57.2% | 67.5% | |||
| North Logan | 68.3% | 60.7% | 75.0% | |||
| Cache (Other)/Rich (All) V2 | 60.2% | 52.5% | 67.5% | |||
| Hyrum | 66.9% | 55.0% | 76.9% | |||
| Smithfield | 66.6% | 57.4% | 74.7% | |||
| Ben Lomond | 71.1% | 66.2% | 75.4% | Higher than the state | ||
| Weber County (East) | 66.1% | 60.0% | 71.8% | |||
| Morgan County | 55.6% | 45.2% | 65.4% | |||
| Ogden (Downtown) | 67.3% | 60.9% | 73.1% | |||
| South Ogden | 62.2% | 56.2% | 67.8% | |||
| Roy/Hooper | 72.9% | 67.0% | 78.1% | Higher than the state | ||
| Riverdale | 73.6% | 66.1% | 79.9% | Higher than the state | ||
| Clearfield Area/Hooper | 75.8% | 71.0% | 80.1% | Higher than the state | ||
| Layton/South Weber | 66.4% | 62.0% | 70.5% | |||
| Kaysville/Fruit Heights | 59.2% | 52.2% | 65.9% | |||
| Syracuse | 71.5% | 64.0% | 78.0% | |||
| Centerville | 70.0% | 59.8% | 78.5% | |||
| Farmington | 59.7% | 50.6% | 68.1% | |||
| North Salt Lake | 60.4% | 51.3% | 68.9% | |||
| Woods Cross/West Bountiful | 68.2% | 56.3% | 78.1% | |||
| Bountiful | 62.1% | 56.0% | 67.8% | |||
| SLC (Rose Park) | 63.0% | 55.5% | 69.9% | |||
| SLC (Avenues) | 37.9% | 30.1% | 46.4% | Lower than the state | ||
| SLC (Foothill/East Bench) | 39.5% | 31.3% | 48.3% | Lower than the state | ||
| Magna | 78.9% | 71.8% | 84.5% | Higher than the state | ||
| SLC (Glendale) V2 | 73.3% | 64.2% | 80.8% | |||
| West Valley (Center) | 73.2% | 66.9% | 78.7% | Higher than the state | ||
| West Valley (West) V2 | 74.2% | 66.3% | 80.8% | Higher than the state | ||
| West Valley (East) V2 | 71.5% | 65.8% | 76.7% | Higher than the state | ||
| SLC (Downtown) V2 | 54.9% | 48.2% | 61.5% | Lower than the state | ||
| SLC (Southeast Liberty) | 46.5% | 37.4% | 55.8% | Lower than the state | ||
| South Salt Lake | 63.6% | 55.8% | 70.8% | |||
| SLC (Sugar House) | 56.0% | 49.7% | 62.1% | Lower than the state | ||
| Millcreek (South) | 46.5% | 38.5% | 54.6% | Lower than the state | ||
| Millcreek (East) | 53.3% | 45.4% | 61.1% | Lower than the state | ||
| Holladay V2 | 50.9% | 43.4% | 58.4% | Lower than the state | ||
| Cottonwood | 52.7% | 45.7% | 59.6% | |||
| Kearns V2 | 78.8% | 72.0% | 84.2% | Higher than the state | ||
| Taylorsville (E)/Murray (W) | 67.0% | 60.6% | 72.8% | |||
| Taylorsville (West) | 70.9% | 64.8% | 76.3% | Higher than the state | ||
| Murray | 60.0% | 52.9% | 66.6% | |||
| Midvale | 72.1% | 65.5% | 77.9% | Higher than the state | ||
| West Jordan (Northeast) V2 | 64.8% | 58.2% | 70.9% | |||
| West Jordan (Southeast) | 71.4% | 65.3% | 76.7% | Higher than the state | ||
| West Jordan (W)/Copperton | 73.8% | 67.4% | 79.3% | Higher than the state | ||
| South Jordan V2 | 64.4% | 57.9% | 70.4% | |||
| Daybreak | 62.8% | 55.3% | 69.8% | |||
| Sandy (West) | 63.9% | 55.8% | 71.2% | |||
| Sandy (Center) V2 | 70.2% | 62.4% | 77.0% | |||
| Sandy (Northeast) | 64.2% | 54.6% | 72.8% | |||
| Sandy (Southeast) | 59.1% | 51.4% | 66.4% | |||
| Draper | 54.5% | 47.3% | 61.6% | Lower than the state | ||
| Riverton/Bluffdale | 66.8% | 61.3% | 71.9% | |||
| Herriman | 69.6% | 63.5% | 75.0% | |||
| Tooele County (Other) | 64.4% | 57.2% | 70.9% | |||
| Tooele Valley | 67.9% | 64.0% | 71.6% | |||
| Eagle Mountain/Cedar Valley | 68.2% | 61.6% | 74.1% | |||
| Lehi | 64.3% | 59.8% | 68.6% | |||
| Saratoga Springs | 67.5% | 61.2% | 73.3% | |||
| American Fork | 63.1% | 57.5% | 68.3% | |||
| Alpine | 50.3% | 40.3% | 60.3% | Lower than the state | ||
| Pleasant Grove/Lindon | 64.3% | 59.7% | 68.6% | |||
| Orem (North) | 72.5% | 66.4% | 77.9% | Higher than the state | ||
| Orem (West) | 61.7% | 55.6% | 67.5% | |||
| Orem (East) | 63.2% | 55.6% | 70.2% | |||
| Provo/BYU | 57.8% | 51.2% | 64.2% | Lower than the state | ||
| Provo (West City Center) | 67.1% | 60.8% | 72.9% | |||
| Provo (East City Center) | 58.8% | 50.3% | 66.7% | |||
| Salem City | 66.4% | 54.8% | 76.2% | |||
| Spanish Fork | 66.6% | 61.1% | 71.7% | |||
| Springville | 67.0% | 60.3% | 73.1% | |||
| Mapleton | 70.4% | 58.8% | 79.8% | |||
| Utah County (South) V2 | 69.7% | 59.6% | 78.2% | |||
| Payson | 68.1% | 61.2% | 74.3% | |||
| Park City | 46.1% | 39.3% | 53.0% | Lower than the state | ||
| Summit County (East) | 61.5% | 53.4% | 69.0% | |||
| Wasatch County | 61.9% | 56.5% | 67.0% | |||
| Daggett and Uintah County | 69.0% | 65.1% | 72.6% | Higher than the state | ||
| Duchesne County | 63.6% | 58.0% | 68.8% | |||
| Nephi/Mona | 65.5% | 55.4% | 74.4% | |||
| Delta/Fillmore | 62.6% | 53.9% | 70.5% | |||
| Sanpete Valley | 62.9% | 55.5% | 69.8% | |||
| Central (Other) | 61.7% | 55.7% | 67.3% | |||
| Richfield/Monroe/Salina | 68.9% | 62.4% | 74.6% | |||
| Carbon County | 67.9% | 62.3% | 73.0% | |||
| Emery County | 72.2% | 62.7% | 80.0% | |||
| Grand County | 57.6% | 47.2% | 67.4% | |||
| Blanding/Monticello | 62.4% | 55.1% | 69.2% | |||
| San Juan County (Other) | 78.3% | 67.0% | 86.4% | Higher than the state | ||
| St. George | 65.2% | 60.7% | 69.5% | |||
| Washington Co (Other) V2 | 64.7% | 53.8% | 74.2% | |||
| Washington City | 65.7% | 56.5% | 73.8% | |||
| Hurricane/La Verkin | 66.6% | 58.6% | 73.7% | |||
| Ivins/Santa Clara | 67.5% | 56.1% | 77.1% | |||
| Cedar City | 62.5% | 56.2% | 68.4% | |||
| Southwest LHD (Other) | 62.2% | 54.4% | 69.3% | |||
| State of Utah | 64.7% | 64.1% | 65.4% | |||
Data Notes
Overweight or obese is defined as a BMI of 25 or more. BMI is calculated by dividing weight in kilograms by the square of height in meters. [[br]] [[br]] Age-adjusted to U.S. 2000 standard population. [[br]] [[br]] A description of the Utah Small Areas may be found on the Methodology and Guidelines page at: [https://ibis.health.utah.gov/resource/Guidelines.html].Data Source
The Utah Department of Health and Human Services Behavioral Risk Factor Surveillance System (BRFSS)References and Community Resources
Healthy Environments Active Living Program, Utah Department of Health and Human Services [[br]] [https://heal.health.utah.gov] The National Center for Chronic Disease Prevention and Health Promotion provides consumer information at [http://www.cdc.gov/nccdphp/dnpa/obesity]. National Institutes of Health: Obesity, Nutrition, an Physical Activity [https://www.nhlbi.nih.gov/science/obesity-nutrition-and-physical-activity] The Surgeon General's Call to Action to Prevent and Decrease Overweight & Obesity: [https://www.ncbi.nlm.nih.gov/books/NBK44206] More information on the Behavioral Risk Factor Surveillance System may be found on the website of the Centers for Disease Control and Prevention - [http://www.cdc.gov/brfss].More Resources and Links
Evidence-based community health improvement ideas and interventions may be found at the following sites:- Centers for Disease Control and Prevention (CDC) WONDER Database, a system for disseminating public health data and information.
- United States Census Bureau data dashboard.
- Utah healthy Places Index, evidence-based and peer-reviewed tool, supports efforts to prioritize equitable community investments, develop critical programs and policies across the state, and much more.
- County Health Rankings
- Kaiser Family Foundation's StateHealthFacts.org
- Medical literature can be queried at PubMed library.
Page Content Updated On 10/31/2022,
Published on 12/20/2022

