Complete Health Indicator Report of Colorectal Cancer Deaths
Definition
The rate of death from cancer of the colon or rectum (ICD-10: C18-C21) per 100,000 persons.Numerator
The number of deaths due to colorectal cancer for a given time period (ICD-10: C18-C21).Denominator
The population in Utah or the U.S. for a given time period.Why Is This Important?
Colorectal cancer is the third most commonly diagnosed cancer and the third most common cause of cancer-related death in both men and women in the United States.^1^ The U.S. Preventive Services Task Force recommends that routine screening for colorectal cancer begin at age 45 for adults at average risk. Persons at high risk may need to begin screening at a younger age. Routine screening can include either an annual fecal occult blood test (gFOBT or FIT), a flexible sigmoidoscopy every five years, a colonoscopy every 10 years, or a double-contrast barium enema every 5 to 10 years. [[br]] [[br]] ---- 1. American Cancer Society, Colorectal Cancer Facts & Figures 2023-2025 Accessed at: [https://www.cancer.org/content/dam/cancer-org/research/cancer-facts-and-statistics/colorectal-cancer-facts-and-figures/colorectal-cancer-facts-and-figures-2023.pdf].[[br]] 2. Centers for Disease Control and Prevention, Colorectal Cancer Screening Tests [https://www.cdc.gov/cancer/colorectal/basic_info/screening/tests.htm#:~:text=How%20often%3A%20Every%2010%20years,increased%20risk%20of%20colorectal%20cancer).].[[br]]How Are We Doing?
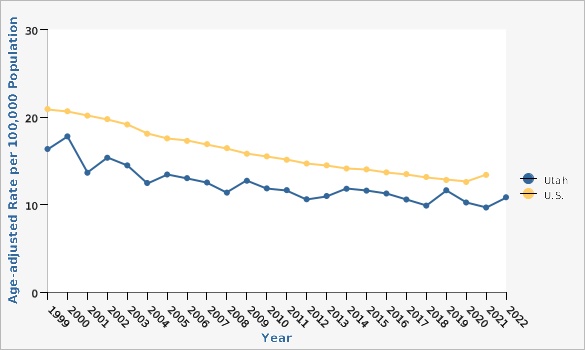
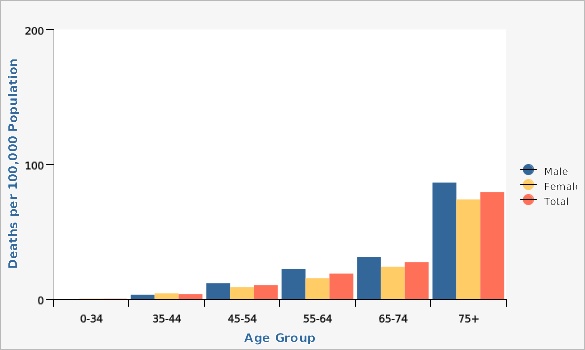
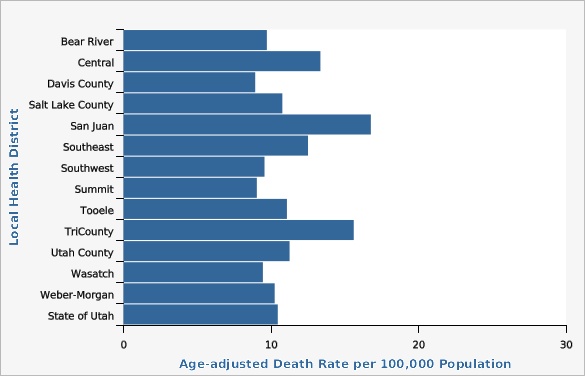
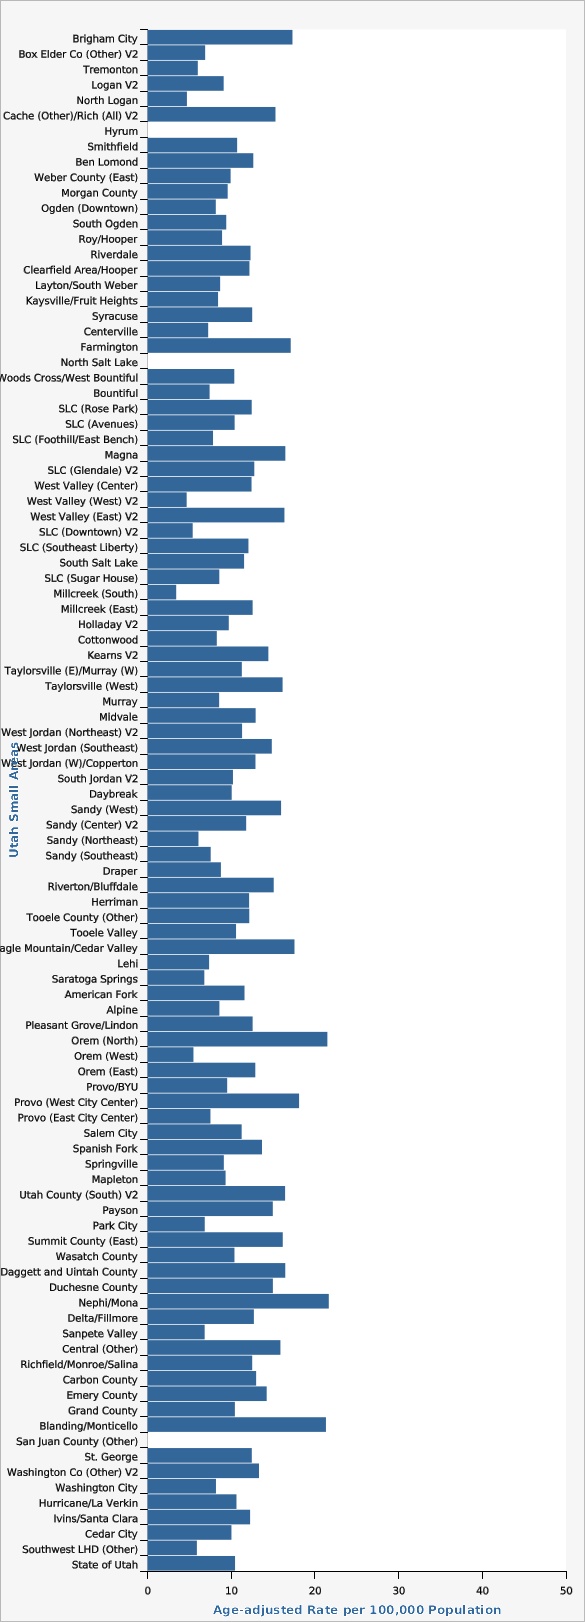
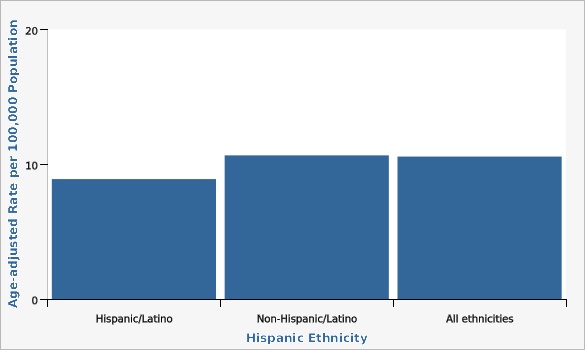
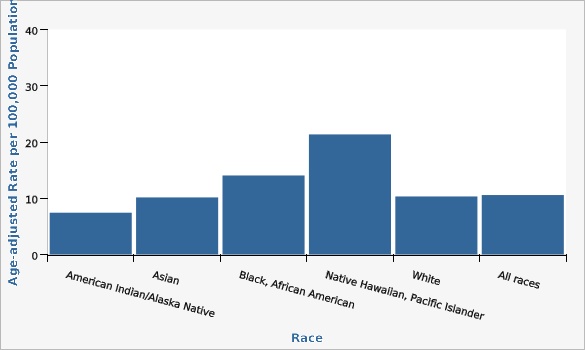
The Utah colorectal cancer mortality rate has decreased significantly, from 17.8 deaths per 100,000 population in the year 2000 to 10.8 deaths per 100,000 population in 2022. Although overall mortality rates have decreased over time, mortality rates vary by age, sex, geography, ethnicity, and race. Looking at data from combined years 2020-2022, rates of colorectal cancer death significantly increase with age for both males and females. Males have higher rates of colorectal cancer deaths than females across all age groups. From 2018 to 2022 combined data, San Juan Local Health District (LHD) had the highest colorectal cancer mortality rate of 16.8 deaths per 100,000 population, while Davis County LHD had the lowest rate with 8.9 deaths per 100,000 population. Other geographical distribution of colorectal cancer deaths can also be viewed in more detail at the Utah Small Area level (see additional data views). For combined years 2018-2022, there was no significant difference in colorectal cancer death rates between those of Hispanic (8.9 deaths per 100,000 population) and non-Hispanic ethnicity (10.7 deaths per 100,000 population). During the same time period, those who identified racially as Pacific Islander/Native Hawaiian had significantly higher colorectal cancer death rates (21.4 deaths per 100,000 population) compared to the overall mortality rate in Utah (10.6 deaths per 100,000 population).How Do We Compare With the U.S.?
The Utah colorectal cancer mortality rate has remained slightly lower than the U.S. mortality rate over time. The latest available data estimates from 2021 show the U.S. colorectal cancer death rate to be 13.4 deaths per 100,000 population, compared to 9.7 deaths per 100,000 population in Utah.What Is Being Done?
Screening for colorectal cancer has recently been identified by the Centers for Disease Control and Prevention (CDC) as a priority public health issue.Available Services
Insurance coverage of colorectal cancer screening tests is required by the Affordable Care Act (ACA). However, the ACA doesn't apply to health plans that were in place before it was passed (so-called grandfathered plans). You can find out your insurance plan's grandfathered status by contacting your health insurance company or your employer's human resources department. If your plan started on or after September 23, 2010, it is required to cover regular colonoscopies and other colorectal cancer screening tests. If a plan started before September 23, 2010, it may still have coverage requirements from state laws, which vary, and other federal laws.Health Program Information
The mission of the Utah Cancer Coalition is to lower cancer incidence, morbidity, and mortality in Utah through collaborative efforts directed toward cancer prevention and control. As a result, they support community-based strategies around food security, healthy neighborhoods, access to health care, and financial toxicity in order to prevent cancer; detect cancer early; and improve the lives of cancer survivors, caregivers, and their families.Related Indicators
Relevant Population Characteristics
The risk of developing colorectal cancer increases with age. Lack of physical activity also contributes to a person's risk of developing colorectal cancer. Smoking, a low fiber and high-fat diet, low fruit and vegetable intake, excessive alcohol use, and obesity may also increase risk.Related Relevant Population Characteristics Indicators:
- Daily Fruit Consumption
- Daily Vegetable Consumption
- Utah Population Characteristics: Age Distribution of the Population
- Alcohol Consumption - Binge Drinking
- Cancer Deaths
- Colorectal Cancer Incidence
- Colorectal Cancer Screening
- Obesity Among Adults
- Physical Activity: Recommended Aerobic Activity Among Adults
Health Care System Factors
Medicare will pay for an annual fecal occult blood test (FOBT), a flexible sigmoidoscopy every four years, and a colonoscopy every 10 years for persons with Medicare aged 50 or older who are at average risk for colorectal cancer. Medicare also covers surveillance of high risk patients (those with a personal history of colorectal cancer or adenomatous polyps or a history of colorectal cancer or adenomatous polyps in a first degree relative or those diagnosed with inflammatory bowel disease) with colonoscopy every two years.Related Health Care System Factors Indicators:
Risk Factors
Risk factors for colorectal cancer include increasing age, inflammatory bowel disease, a family history of polyps or colorectal cancer, a personal history of polyps or colorectal cancer, and certain hereditary syndromes. Physical inactivity, a low fiber/high fat diet, obesity, excessive alcohol consumption, and tobacco use may all increase risk. A diet high in fruits and vegetables, hormone replacement therapy in post-menopausal women, and aspirin use may reduce colorectal cancer risk.Related Risk Factors Indicators:
Related Health Status Outcomes Indicators:
Graphical Data Views
| Utah vs. U.S. | Year | Age-adjusted Rate per 100,000 Population | Lower Limit | Upper Limit | ||
|---|---|---|---|---|---|---|
Record Count: 47 | ||||||
| Utah | 1999 | 16.4 | 14.4 | 18.6 | ||
| Utah | 2000 | 17.8 | 15.8 | 20.0 | ||
| Utah | 2001 | 13.6 | 11.9 | 15.6 | ||
| Utah | 2002 | 15.4 | 13.5 | 17.4 | ||
| Utah | 2003 | 14.5 | 12.7 | 16.4 | ||
| Utah | 2004 | 12.5 | 10.8 | 14.3 | ||
| Utah | 2005 | 13.4 | 11.8 | 15.3 | ||
| Utah | 2006 | 13.0 | 11.4 | 14.8 | ||
| Utah | 2007 | 12.5 | 11.0 | 14.2 | ||
| Utah | 2008 | 11.4 | 9.9 | 13.0 | ||
| Utah | 2009 | 12.7 | 11.2 | 14.4 | ||
| Utah | 2010 | 11.9 | 10.4 | 13.4 | ||
| Utah | 2011 | 11.6 | 10.2 | 13.2 | ||
| Utah | 2012 | 10.6 | 9.3 | 12.1 | ||
| Utah | 2013 | 11.0 | 9.7 | 12.4 | ||
| Utah | 2014 | 11.8 | 10.4 | 13.3 | ||
| Utah | 2015 | 11.6 | 10.3 | 13.1 | ||
| Utah | 2016 | 11.3 | 10.0 | 12.7 | ||
| Utah | 2017 | 10.6 | 9.4 | 11.9 | ||
| Utah | 2018 | 9.9 | 8.7 | 11.1 | ||
| Utah | 2019 | 11.6 | 10.4 | 13.0 | ||
| Utah | 2020 | 10.2 | 9.1 | 11.5 | ||
| Utah | 2021 | 9.7 | 8.6 | 10.9 | ||
| Utah | 2022 | 10.8 | 9.7 | 12.1 | ||
| U.S. | 1999 | 20.9 | 20.8 | 21.1 | ||
| U.S. | 2000 | 20.7 | 20.5 | 20.8 | ||
| U.S. | 2001 | 20.2 | 20.0 | 20.3 | ||
| U.S. | 2002 | 19.8 | 19.6 | 19.9 | ||
| U.S. | 2003 | 19.2 | 19.0 | 19.3 | ||
| U.S. | 2004 | 18.1 | 17.9 | 18.2 | ||
| U.S. | 2005 | 17.6 | 17.4 | 17.7 | ||
| U.S. | 2006 | 17.3 | 17.1 | 17.4 | ||
| U.S. | 2007 | 16.9 | 16.8 | 17.0 | ||
| U.S. | 2008 | 16.5 | 16.3 | 16.6 | ||
| U.S. | 2009 | 15.8 | 15.7 | 15.9 | ||
| U.S. | 2010 | 15.5 | 15.4 | 15.6 | ||
| U.S. | 2011 | 15.1 | 15.0 | 15.2 | ||
| U.S. | 2012 | 14.7 | 14.6 | 14.8 | ||
| U.S. | 2013 | 14.5 | 14.4 | 14.6 | ||
| U.S. | 2014 | 14.1 | 14.0 | 14.2 | ||
| U.S. | 2015 | 14.0 | 13.9 | 14.1 | ||
| U.S. | 2016 | 13.7 | 13.6 | 13.8 | ||
| U.S. | 2017 | 13.5 | 13.4 | 13.6 | ||
| U.S. | 2018 | 13.2 | 13.0 | 13.3 | ||
| U.S. | 2019 | 12.8 | 12.7 | 12.9 | ||
| U.S. | 2020 | 12.6 | 12.5 | 12.7 | ||
| U.S. | 2021 | 13.4 | 13.2 | 13.5 | ||
Data Notes
ICD-10 codes used to define colorectal cancer: C18-C21. Age-adjusted to U.S. 2000 standard population using 11 age adjustment age groups: (0, 1-4, 5-14, 15-24, 25-34, 35-44, 45-54, 55-64,65-74, 75-84, 85+).Data Sources
- Utah Death Certificate Database, Office of Vital Records and Statistics, Utah Department of Health and Human Services
- Population Estimates for 1999 and earlier: Utah Governor's Office of Planning and Budget
- For years 2020 and later, the population estimates are provided by the Kem C. Gardner Policy Institute, Utah state and county annual population estimates are by single year of age and sex, IBIS Version 2022
- Population Estimates for 2000-2019: National Center for Health Statistics (NCHS) through a collaborative agreement with the U.S. Census Bureau, IBIS Version 2020
- U.S. Cancer Statistics: WONDER Online Database. United States Department of Health and Human Services, Centers for Disease Control and Prevention and National Cancer Institute. Accessed at [http://wonder.cdc.gov/cancer.html]
- National Vital Statistics System, National Center for Health Statistics, U.S. Centers for Disease Control and Prevention
| Males vs. Females | Age Group | Deaths per 100,000 Population | Lower Limit | Upper Limit | Note | |
|---|---|---|---|---|---|---|
Record Count: 18 | ||||||
| Male | 0-34 | ** | ** | |||
| Male | 35-44 | 3.1 | 2.0 | 4.7 | ||
| Male | 45-54 | 11.8 | 9.0 | 15.1 | ||
| Male | 55-64 | 22.3 | 18.2 | 27.0 | ||
| Male | 65-74 | 31.2 | 25.6 | 37.6 | ||
| Male | 75+ | 86.4 | 74.1 | 100.2 | ||
| Female | 0-34 | 0.3 | 0.1 | 0.5 | * | |
| Female | 35-44 | 4.2 | 2.9 | 6.1 | ||
| Female | 45-54 | 8.8 | 6.5 | 11.8 | ||
| Female | 55-64 | 15.5 | 12.1 | 19.5 | ||
| Female | 65-74 | 23.9 | 19.2 | 29.4 | ||
| Female | 75+ | 73.9 | 63.8 | 85.1 | ||
| Total | 0-34 | 0.2 | 0.1 | 0.3 | * | |
| Total | 35-44 | 3.7 | 2.7 | 4.8 | ||
| Total | 45-54 | 10.3 | 8.5 | 12.5 | ||
| Total | 55-64 | 18.8 | 16.2 | 21.8 | ||
| Total | 65-74 | 27.4 | 23.7 | 31.5 | ||
| Total | 75+ | 79.4 | 71.4 | 87.9 | ||
Data Notes
Codes used to define colorectal cancer: ICD-10 C18-21. [[br]] *Use caution in interpreting, the estimate has a relative standard error greater than 30% and does not meet DHHS standards for reliability. For more information, please go to [http://ibis.health.utah.gov/pdf/resource/DataSuppression.pdf].[[br]] ^ ^**The estimate has been suppressed because 1) the relative standard error is greater than 50% or 2) the observed number of events is very small and not appropriate for publication.Data Sources
- Utah Death Certificate Database, Office of Vital Records and Statistics, Utah Department of Health and Human Services
- For years 2020 and later, the population estimates are provided by the Kem C. Gardner Policy Institute, Utah state and county annual population estimates are by single year of age and sex, IBIS Version 2022
| Local Health District | Age-adjusted Death Rate per 100,000 Population | Lower Limit | Upper Limit | |||
|---|---|---|---|---|---|---|
Record Count: 14 | ||||||
| Bear River | 9.7 | 7.7 | 12.2 | |||
| Central | 13.4 | 10.1 | 17.3 | |||
| Davis County | 8.9 | 7.5 | 10.6 | |||
| Salt Lake County | 10.8 | 9.9 | 11.7 | |||
| San Juan | 16.8 | 8.8 | 28.9 | |||
| Southeast | 12.5 | 8.3 | 18.2 | |||
| Southwest | 9.6 | 8.1 | 11.2 | |||
| Summit | 9.0 | 5.2 | 14.7 | |||
| Tooele | 11.1 | 7.3 | 16.1 | |||
| TriCounty | 15.6 | 11.1 | 21.4 | |||
| Utah County | 11.3 | 9.8 | 12.8 | |||
| Wasatch | 9.4 | 5.3 | 15.6 | |||
| Weber-Morgan | 10.2 | 8.6 | 12.2 | |||
| State of Utah | 10.5 | 9.9 | 11.0 | |||
Data Notes
Codes used to define colorectal cancer: ICD-10 C18-21.[[br]] Age-adjusted to U.S. 2000 standard population using 11 age adjustment age groups: (0, 1-4, 5-14, 15-24, 25-34, 35-44, 45-54, 55-64,65-74, 75-84, 85+).[[br]]Data Sources
- Utah Death Certificate Database, Office of Vital Records and Statistics, Utah Department of Health and Human Services
- For years 2020 and later, the population estimates are provided by the Kem C. Gardner Policy Institute, Utah state and county annual population estimates are by single year of age and sex, IBIS Version 2022
- Population Estimates for 2000-2019: National Center for Health Statistics (NCHS) through a collaborative agreement with the U.S. Census Bureau, IBIS Version 2020
| Utah Small Areas | Age-adjusted Rate per 100,000 Population | Lower Limit | Upper Limit | Note | ||
|---|---|---|---|---|---|---|
Record Count: 103 | ||||||
| Brigham City | 17.3 | 11.1 | 25.8 | |||
| Box Elder Co (Other) V2 | 6.9 | 1.8 | 18.0 | * | ||
| Tremonton | 6.0 | 1.9 | 14.2 | * | ||
| Logan V2 | 9.1 | 5.5 | 14.2 | |||
| North Logan | 4.7 | 1.2 | 12.2 | * | ||
| Cache (Other)/Rich (All) V2 | 15.3 | 8.6 | 25.0 | |||
| Hyrum | ** | ** | ||||
| Smithfield | 10.7 | 3.8 | 23.6 | * | ||
| Ben Lomond | 12.6 | 8.8 | 17.7 | |||
| Weber County (East) | 9.9 | 6.0 | 15.5 | |||
| Morgan County | 9.6 | 3.0 | 22.9 | * | ||
| Ogden (Downtown) | 8.2 | 4.4 | 13.9 | |||
| South Ogden | 9.4 | 5.5 | 15.0 | |||
| Roy/Hooper | 8.9 | 5.3 | 14.0 | |||
| Riverdale | 12.3 | 7.3 | 19.4 | |||
| Clearfield Area/Hooper | 12.2 | 8.0 | 17.8 | |||
| Layton/South Weber | 8.7 | 5.8 | 12.5 | |||
| Kaysville/Fruit Heights | 8.4 | 4.5 | 14.3 | |||
| Syracuse | 12.5 | 5.9 | 23.4 | * | ||
| Centerville | 7.2 | 2.6 | 15.8 | * | ||
| Farmington | 17.1 | 9.4 | 28.6 | |||
| North Salt Lake | ** | ** | ||||
| Woods Cross/West Bountiful | 10.4 | 3.5 | 23.7 | * | ||
| Bountiful | 7.4 | 4.5 | 11.6 | |||
| SLC (Rose Park) | 12.4 | 7.1 | 20.2 | |||
| SLC (Avenues) | 10.4 | 5.7 | 17.5 | |||
| SLC (Foothill/East Bench) | 7.8 | 3.6 | 14.9 | * | ||
| Magna | 16.5 | 9.2 | 27.2 | |||
| SLC (Glendale) V2 | 12.8 | 5.8 | 24.4 | * | ||
| West Valley (Center) | 12.4 | 7.9 | 18.6 | |||
| West Valley (West) V2 | 4.7 | 1.3 | 11.7 | * | ||
| West Valley (East) V2 | 16.4 | 11.1 | 23.3 | |||
| SLC (Downtown) V2 | 5.4 | 2.4 | 10.3 | * | ||
| SLC (Southeast Liberty) | 12.1 | 6.0 | 21.6 | |||
| South Salt Lake | 11.5 | 6.4 | 19.3 | |||
| SLC (Sugar House) | 8.6 | 5.0 | 13.8 | |||
| Millcreek (South) | 3.4 | 1.1 | 8.1 | * | ||
| Millcreek (East) | 12.6 | 7.4 | 20.0 | |||
| Holladay V2 | 9.7 | 5.7 | 15.5 | |||
| Cottonwood | 8.3 | 5.3 | 12.3 | |||
| Kearns V2 | 14.4 | 8.1 | 23.8 | |||
| Taylorsville (E)/Murray (W) | 11.3 | 7.0 | 17.2 | |||
| Taylorsville (West) | 16.1 | 10.5 | 23.7 | |||
| Murray | 8.6 | 4.9 | 13.8 | |||
| Midvale | 12.9 | 7.9 | 20.0 | |||
| West Jordan (Northeast) V2 | 11.3 | 5.9 | 19.6 | |||
| West Jordan (Southeast) | 14.8 | 8.7 | 23.6 | |||
| West Jordan (W)/Copperton | 12.9 | 7.0 | 21.8 | |||
| South Jordan V2 | 10.2 | 6.3 | 15.7 | |||
| Daybreak | 10.1 | 4.4 | 19.7 | * | ||
| Sandy (West) | 16.0 | 10.1 | 24.0 | |||
| Sandy (Center) V2 | 11.8 | 6.6 | 19.3 | |||
| Sandy (Northeast) | 6.1 | 2.6 | 12.0 | * | ||
| Sandy (Southeast) | 7.6 | 3.9 | 13.2 | |||
| Draper | 8.8 | 5.0 | 14.4 | |||
| Riverton/Bluffdale | 15.1 | 9.3 | 23.2 | |||
| Herriman | 12.1 | 5.9 | 22.0 | |||
| Tooele County (Other) | 12.2 | 5.0 | 24.9 | * | ||
| Tooele Valley | 10.6 | 6.5 | 16.2 | |||
| Eagle Mountain/Cedar Valley | 17.6 | 7.5 | 34.8 | |||
| Lehi | 7.4 | 3.8 | 12.8 | |||
| Saratoga Springs | 6.8 | 2.0 | 16.6 | * | ||
| American Fork | 11.6 | 7.2 | 17.6 | |||
| Alpine | 8.6 | 2.3 | 22.4 | * | ||
| Pleasant Grove/Lindon | 12.6 | 8.2 | 18.5 | |||
| Orem (North) | 21.5 | 14.2 | 31.2 | |||
| Orem (West) | 5.5 | 2.3 | 10.9 | * | ||
| Orem (East) | 12.9 | 7.3 | 21.1 | |||
| Provo/BYU | 9.5 | 5.1 | 16.2 | |||
| Provo (West City Center) | 18.1 | 10.4 | 29.3 | |||
| Provo (East City Center) | 7.5 | 2.0 | 19.4 | * | ||
| Salem City | 11.2 | 3.5 | 26.7 | * | ||
| Spanish Fork | 13.7 | 8.1 | 21.7 | |||
| Springville | 9.1 | 4.5 | 16.4 | * | ||
| Mapleton | 9.3 | 2.5 | 23.9 | * | ||
| Utah County (South) V2 | 16.4 | 6.5 | 34.3 | * | ||
| Payson | 15.0 | 8.3 | 24.9 | |||
| Park City | 6.8 | 2.5 | 14.8 | * | ||
| Summit County (East) | 16.2 | 7.4 | 30.6 | * | ||
| Wasatch County | 10.4 | 5.8 | 17.2 | |||
| Daggett and Uintah County | 16.5 | 10.6 | 24.3 | |||
| Duchesne County | 15.0 | 8.0 | 25.4 | |||
| Nephi/Mona | 21.7 | 9.7 | 41.7 | * | ||
| Delta/Fillmore | 12.7 | 4.9 | 26.9 | * | ||
| Sanpete Valley | 6.8 | 2.4 | 15.1 | * | ||
| Central (Other) | 15.9 | 9.8 | 24.3 | |||
| Richfield/Monroe/Salina | 12.5 | 6.5 | 21.9 | |||
| Carbon County | 13.0 | 6.9 | 22.2 | |||
| Emery County | 14.2 | 5.4 | 30.2 | * | ||
| Grand County | 10.4 | 4.1 | 21.8 | * | ||
| Blanding/Monticello | 21.3 | 9.6 | 40.7 | * | ||
| San Juan County (Other) | ** | ** | ||||
| St. George | 12.5 | 9.6 | 15.9 | |||
| Washington Co (Other) V2 | 13.3 | 6.8 | 23.4 | |||
| Washington City | 8.2 | 4.3 | 14.0 | |||
| Hurricane/La Verkin | 10.6 | 5.9 | 17.7 | |||
| Ivins/Santa Clara | 12.3 | 6.5 | 21.0 | |||
| Cedar City | 10.0 | 6.1 | 15.5 | |||
| Southwest LHD (Other) | 5.9 | 2.8 | 11.0 | * | ||
| State of Utah | 10.5 | 9.9 | 11.0 | |||
Data Notes
Age-adjusted to the U.S. 2000 standard population using 11 age adjustment age groups: (0, 1-4, 5-14, 15-24, 25-34, 35-44, 45-54, 55-64,65-74, 75-84, 85+). *Use caution in interpreting, the estimate has a relative standard error greater than 30% and does not meet DHHS standards for reliability. For more information, please go to [http://ibis.health.utah.gov/pdf/resource/DataSuppression.pdf]. **The estimate has been suppressed because 1) the relative standard error is greater than 50% or 2) the observed number of events is very small and not appropriate for publication. A description of the Utah Small Areas may be found on IBIS at the following URL: [https://ibis.health.utah.gov/resource/Guidelines.html].Data Sources
- Utah Death Certificate Database, Office of Vital Records and Statistics, Utah Department of Health and Human Services
- Population estimates used linear interpolation of U.S. Census Bureau, Kem C. Gardner Policy Institute population estimates, and ESRI ZIP Code data provided annual population estimates for ZIP Code areas by sex and age groups, IBIS Version 2022
| Hispanic Ethnicity | Age-adjusted Rate per 100,000 Population | Lower Limit | Upper Limit | |||
|---|---|---|---|---|---|---|
Record Count: 3 | ||||||
| Hispanic/Latino | 8.9 | 7.1 | 11.0 | |||
| Non-Hispanic/Latino | 10.7 | 10.1 | 11.2 | |||
| All ethnicities | 10.6 | 10.0 | 11.1 | |||
Data Notes
Codes used to define colorectal cancer: ICD-10 C18-21.[[br]] Age-adjusted to U.S. 2000 standard population using 10 age adjustment age groups: (0-4, 5-14, 15-24, 25-34, 35-44, 45-54, 55-64,65-74, 75-84, 85+).Data Sources
- Utah Death Certificate Database, Office of Vital Records and Statistics, Utah Department of Health and Human Services
- Population Estimates by Age, Sex, Race, and Hispanic Origin for Counties in Utah, U.S. Bureau of the Census, IBIS Version 2022
| Race | Age-adjusted Rate per 100,000 Population | Lower Limit | Upper Limit | Note | ||
|---|---|---|---|---|---|---|
Record Count: 6 | ||||||
| American Indian/Alaska Native | 7.4 | 3.5 | 13.8 | * | ||
| Asian | 10.2 | 6.9 | 14.4 | |||
| Black, African American | 14.0 | 7.0 | 25.1 | |||
| Native Hawaiian, Pacific Islander | 21.4 | 13.3 | 32.4 | |||
| White | 10.3 | 9.8 | 10.9 | |||
| All races | 10.6 | 10.0 | 11.1 | |||
Data Notes
Codes used to define colorectal cancer: ICD-10 C18-21.[[br]] Rates are age-adjusted to the 2000 U.S. standard population using 10 age groups: (0-4, 5-14, 15-24, 25-34, 35-44, 45-54, 55-64,65-74, 75-84, 85+) *Use caution in interpreting; the estimate has a coefficient of variation > 30% and is therefore deemed unreliable by Utah Department of Health and Human Services standards.Data Sources
- Utah Death Certificate Database, Office of Vital Records and Statistics, Utah Department of Health and Human Services
- Population Estimates by Age, Sex, Race, and Hispanic Origin for Counties in Utah, U.S. Bureau of the Census, IBIS Version 2022
References and Community Resources
Utah Breast & Cervical Cancer Program: [https://cancer.utah.gov/][[br]] Utah Cancer Coalition: [https://utahcancercoalition.org/][[br]] American Cancer Society: [http://www.cancer.org][[br]] National Cancer Institute: [http://www.cancer.gov][[br]] Huntsman Cancer Institute: [https://healthcare.utah.edu/huntsmancancerinstitute/screening-prevention][[br]] Centers for Disease Control and Prevention: [http://www.cdc.gov][[br]] American Society of Clinical Oncology: [http://www.asco.org]More Resources and Links
Evidence-based community health improvement ideas and interventions may be found at the following sites:- Centers for Disease Control and Prevention (CDC) WONDER Database, a system for disseminating public health data and information.
- United States Census Bureau data dashboard.
- Utah healthy Places Index, evidence-based and peer-reviewed tool, supports efforts to prioritize equitable community investments, develop critical programs and policies across the state, and much more.
- County Health Rankings
- Kaiser Family Foundation's StateHealthFacts.org
- Medical literature can be queried at PubMed library.
Page Content Updated On 01/05/2024,
Published on 04/22/2024

