Complete Health Indicator Report of Prostate cancer incidence
Definition
The rate of prostate cancer incidence in Utah per 100,000 males.Numerator
The number of incidents of prostate cancer among Utah men for a given time period.Denominator
The population of Utah for a specific time period.Why Is This Important?
Prostate cancer is the most commonly occurring form of cancer (excluding skin cancer) among men and is the second leading cause of cancer-related death for men in Utah. All men older than age of 40 should visit their doctor for routine health visits annually, which may include a discussion on prostate health.Healthy People Objective C-19:
Increase the proportion of men who have discussed the advantages and disadvantages of the prostate-specific antigen (PSA) test to screen for prostate cancer with their health care providerU.S. Target: 15.9 percent
How Are We Doing?
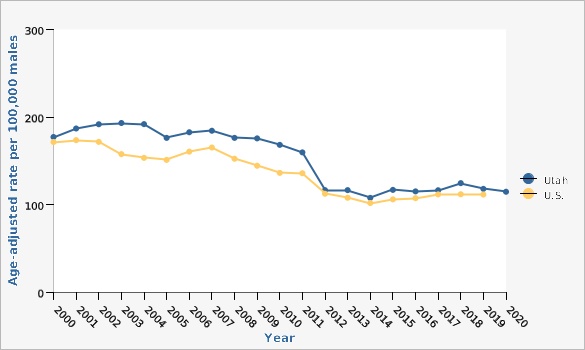
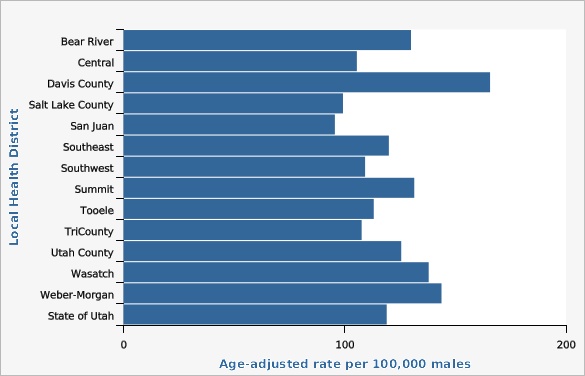
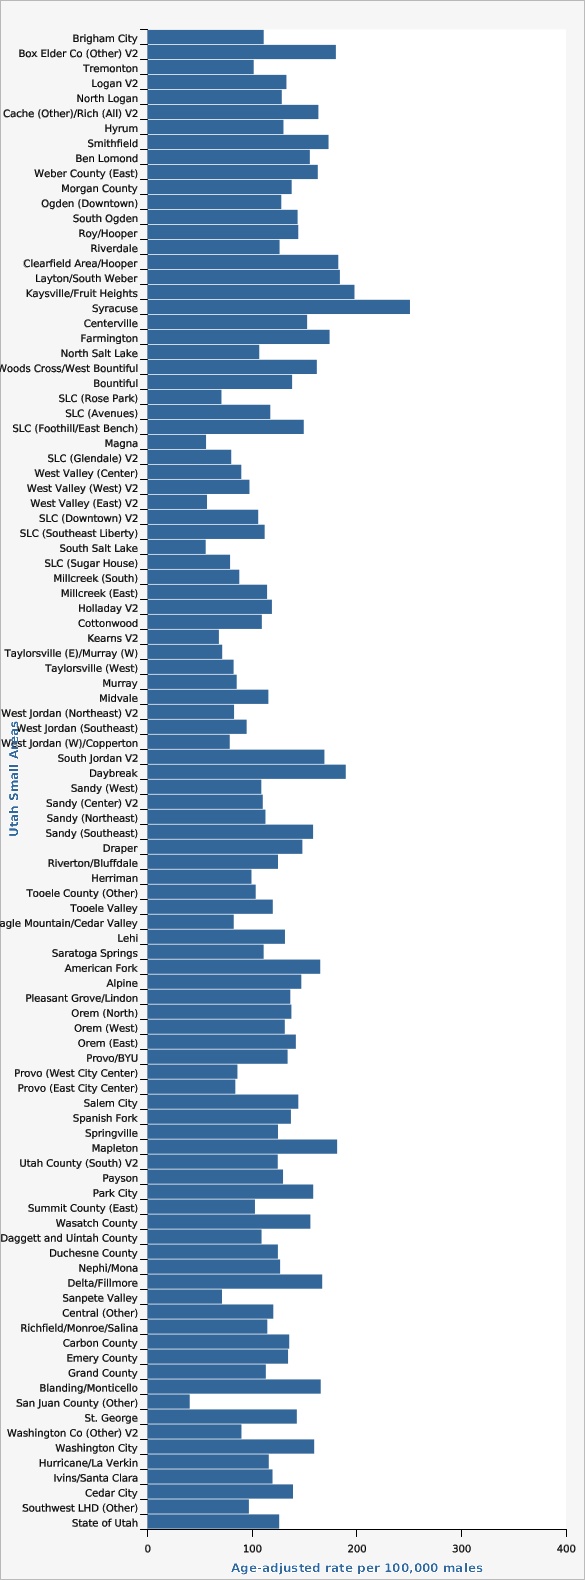
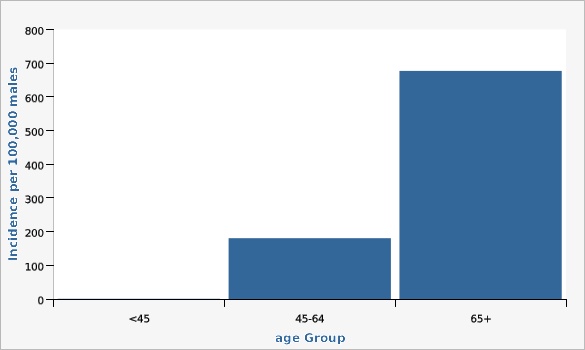
In 2017, Utah's age-adjusted incidence rate of prostate cancer was 112.2 cases per 100,000 men. From 2015-2017, the highest rates of age-adjusted prostate cancer incidence were found in Summit County LHD (171.2 cases per 100,000 men) and Tooele County LHD (166.1 cases per 100,000 men), while the lowest rates of age-adjusted prostate cancer incidence were found in San Juan LHD (31.4 cases per 100,000 men) and Central Utah LHD (88.1 cases per 100,000 men). These differences were statistically significant compared to the state age-adjusted rate during the same time period. For more information on the geographical distribution of prostate cancer incidence, see the Utah Small Areas view. From 2014-2016 Utah Hispanic men had a significantly lower age-adjusted incidence rate of prostate cancer (80.9 cases per 100,000 men) compared to non-Hispanic men (110.3 cases per 100,000 men). Men who racially identified as Native Hawaiian/Other Pacific Islander or Black/African American had significantly higher rates of prostate cancer incidence (154.8 cases and 164.8 cases per 100,000 men, respectively) compared to Asian and American Indian/Alaskan Native men who had the lowest rates of prostate cancer incidence (43.6 cases and 38.9 cases per 100,000 men, respectively). Incidence of prostate cancer increases significantly with age. The highest rates of prostate cancer incidence in Utah are found in males older than 65 years of age (632.9 cases per 100,000 men), while rates for men age 45-64 are also high (182.4 cases per 100,000 men). Prostate cancer is very rare among men younger than 45 years of age (0.6 cases per 100,000 men).How Do We Compare With the U.S.?
In 2016 (the most recent comparison data available), Utah's age-adjusted incidence rate of prostate cancer of 113.2 cases per 100,000 males was significantly higher than the U.S. rate of 101.4 cases per 100,000 males.What Is Being Done?
The Utah Comprehensive Cancer Control program (CCC) and its affiliated coalition, the Utah Cancer Action Network (UCAN), work together with state and local partners to reduce the burden of cancer in Utah. Their mission is to lower cancer incidence, morbidity, and mortality in Utah through collaborative efforts directed toward cancer prevention and control. As a result, they support community-based strategies around food security, healthy neighborhoods, access to health care, and financial toxicity in order to prevent cancer; detect cancer early; and improve the lives of cancer survivors, caregivers, and their families.Evidence-based Practices
Screening recommendations have changed over time. Until recently, many doctors and professional organizations encouraged yearly prostate-specific antigen (PSA) screening for men beginning at age 50. However, as more has been learned about both the benefits and harms of prostate cancer screening, a number of organizations have begun to caution against routine population screening. Although some organizations continue to recommend PSA screening, there is widespread agreement that any man who is considering getting tested should first be informed in detail about the potential harms and benefits. Currently, Medicare provides coverage for an annual PSA test for all Medicare-eligible men age 50 and older. Many private insurers cover PSA screening as well. Since 2018, the U.S. Preventive Services Task Force (USPSTF) recommends that those aged 55-69 with a prostate discuss the potential benefits and potential harms of prostate-specific antigen (PSA)-based screening for prostate cancer before deciding on whether or not to be screened. Healthy diet, exercise, and lifestyle play an important role in cancer prevention.Related Indicators
Related Relevant Population Characteristics Indicators:
Graphical Data Views
| Utah vs. U.S. | Year | Age-adjusted rate per 100,000 males | Lower Limit | Upper Limit | ||
|---|---|---|---|---|---|---|
Record Count: 41 | ||||||
| Utah | 2000 | 177.2 | 167.4 | 187.4 | ||
| Utah | 2001 | 187.0 | 177.1 | 197.3 | ||
| Utah | 2002 | 191.8 | 182.0 | 202.0 | ||
| Utah | 2003 | 193.2 | 183.4 | 203.4 | ||
| Utah | 2004 | 191.9 | 182.4 | 201.8 | ||
| Utah | 2005 | 176.2 | 167.3 | 185.5 | ||
| Utah | 2006 | 182.7 | 173.8 | 191.9 | ||
| Utah | 2007 | 184.3 | 175.5 | 193.4 | ||
| Utah | 2008 | 176.2 | 167.8 | 184.9 | ||
| Utah | 2009 | 175.6 | 167.4 | 184.2 | ||
| Utah | 2010 | 168.3 | 160.4 | 176.5 | ||
| Utah | 2011 | 159.7 | 152.1 | 167.6 | ||
| Utah | 2012 | 116.6 | 110.2 | 123.2 | ||
| Utah | 2013 | 116.5 | 110.3 | 123.0 | ||
| Utah | 2014 | 107.8 | 101.9 | 113.9 | ||
| Utah | 2015 | 116.8 | 110.8 | 123.0 | ||
| Utah | 2016 | 115.1 | 109.2 | 121.2 | ||
| Utah | 2017 | 116.4 | 110.6 | 122.4 | ||
| Utah | 2018 | 124.6 | 118.7 | 130.7 | ||
| Utah | 2019 | 118.0 | 112.4 | 123.8 | ||
| Utah | 2020 | 114.7 | 109.2 | 120.3 | ||
| U.S. | 2000 | 171.5 | 170.8 | 172.3 | ||
| U.S. | 2001 | 173.7 | 172.9 | 174.4 | ||
| U.S. | 2002 | 171.6 | 170.9 | 172.4 | ||
| U.S. | 2003 | 157.6 | 157.0 | 158.4 | ||
| U.S. | 2004 | 153.4 | 152.7 | 154.1 | ||
| U.S. | 2005 | 151.1 | 150.4 | 151.7 | ||
| U.S. | 2006 | 160.5 | 159.9 | 161.2 | ||
| U.S. | 2007 | 165.2 | 164.6 | 165.9 | ||
| U.S. | 2008 | 152.4 | 151.8 | 153.1 | ||
| U.S. | 2009 | 144.4 | 143.8 | 145.1 | ||
| U.S. | 2010 | 136.3 | 135.8 | 136.9 | ||
| U.S. | 2011 | 135.9 | 135.3 | 136.5 | ||
| U.S. | 2012 | 112.5 | 112.0 | 113.0 | ||
| U.S. | 2013 | 107.9 | 107.4 | 108.4 | ||
| U.S. | 2014 | 101.8 | 101.3 | 102.3 | ||
| U.S. | 2015 | 106.0 | 105.6 | 106.5 | ||
| U.S. | 2016 | 107.4 | 107.0 | 107.9 | ||
| U.S. | 2017 | 111.7 | 111.2 | 112.2 | ||
| U.S. | 2018 | 111.9 | 111.4 | 112.4 | ||
| U.S. | 2019 | 111.6 | 111.1 | 112.1 | ||
Data Notes
^ ^Age-adjusted to U.S. 2000 population. [[br]] ^ ^*U.S. Data available through 2019Data Sources
- Cancer data provided by the Utah Cancer Registry, supported by the National Cancer Institute (HHSN261201800016I), the U.S. Center for Disease Control and Prevention (NU58DP0063200), the University of Utah, and Huntsman Cancer Foundation
- U.S. Cancer Statistics: WONDER Online Database. United States Department of Health and Human Services, Centers for Disease Control and Prevention and National Cancer Institute. Accessed at [http://wonder.cdc.gov/cancer.html]
| Local Health District | Age-adjusted rate per 100,000 males | Lower Limit | Upper Limit | |||
|---|---|---|---|---|---|---|
Record Count: 14 | ||||||
| Bear River | 130.0 | 115.7 | 145.5 | |||
| Central | 105.5 | 89.7 | 123.2 | |||
| Davis County | 165.7 | 153.7 | 178.3 | |||
| Salt Lake County | 99.2 | 94.2 | 104.4 | |||
| San Juan | 95.5 | 61.4 | 141.8 | |||
| Southeast | 119.9 | 97.7 | 145.7 | |||
| Southwest | 109.2 | 100.3 | 118.7 | |||
| Summit | 131.4 | 107.0 | 159.8 | |||
| Tooele | 113.1 | 91.5 | 138.3 | |||
| TriCounty | 107.6 | 86.4 | 132.5 | |||
| Utah County | 125.5 | 116.6 | 135.0 | |||
| Wasatch | 137.9 | 107.9 | 173.8 | |||
| Weber-Morgan | 143.7 | 131.9 | 156.3 | |||
| State of Utah | 119.0 | 115.7 | 122.3 | |||
Data Notes
Age-adjusted to U.S. 2000 population. [[br]] ^ ^^Prior to 2015 San Juan County was part of the Southeast Local Health District. In 2015 the San Juan County Local Health District was formed. Data reported are for all years using the current boundaries.Data Source
Cancer data provided by the Utah Cancer Registry, supported by the National Cancer Institute (HHSN261201800016I), the U.S. Center for Disease Control and Prevention (NU58DP0063200), the University of Utah, and Huntsman Cancer Foundation| Utah Small Areas | Age-adjusted rate per 100,000 males | Lower Limit | Upper Limit | |||
|---|---|---|---|---|---|---|
Record Count: 100 | ||||||
| Brigham City | 111.1 | 80.1 | 150.0 | |||
| Box Elder Co (Other) V2 | 180.0 | 124.3 | 252.3 | |||
| Tremonton | 101.5 | 64.4 | 152.1 | |||
| Logan V2 | 132.8 | 104.0 | 167.1 | |||
| North Logan | 128.4 | 85.8 | 184.6 | |||
| Cache (Other)/Rich (All) V2 | 163.3 | 123.2 | 212.4 | |||
| Hyrum | 130.0 | 66.6 | 228.3 | |||
| Smithfield | 173.0 | 114.2 | 251.4 | |||
| Ben Lomond | 155.2 | 129.3 | 184.6 | |||
| Weber County (East) | 162.8 | 133.7 | 196.2 | |||
| Morgan County | 137.8 | 90.1 | 201.7 | |||
| Ogden (Downtown) | 127.9 | 98.6 | 163.1 | |||
| South Ogden | 143.5 | 114.0 | 178.2 | |||
| Roy/Hooper | 144.1 | 115.4 | 177.8 | |||
| Riverdale | 126.2 | 94.0 | 166.0 | |||
| Clearfield Area/Hooper | 182.4 | 151.0 | 218.4 | |||
| Layton/South Weber | 183.9 | 158.0 | 212.8 | |||
| Kaysville/Fruit Heights | 197.8 | 158.7 | 243.7 | |||
| Syracuse | 250.9 | 191.9 | 322.2 | |||
| Centerville | 152.6 | 109.5 | 206.9 | |||
| Farmington | 174.0 | 127.3 | 232.3 | |||
| North Salt Lake | 106.8 | 66.1 | 163.4 | |||
| Woods Cross/West Bountiful | 161.8 | 102.6 | 242.8 | |||
| Bountiful | 138.2 | 114.0 | 166.1 | |||
| SLC (Rose Park) | 70.7 | 45.7 | 104.4 | |||
| SLC (Avenues) | 117.4 | 87.5 | 154.2 | |||
| SLC (Foothill/East Bench) | 149.4 | 111.0 | 196.7 | |||
| Magna | 56.0 | 30.1 | 95.0 | |||
| SLC (Glendale) V2 | 80.0 | 48.0 | 125.3 | |||
| West Valley (Center) | 89.7 | 67.4 | 116.9 | |||
| West Valley (West) V2 | 97.4 | 63.2 | 143.6 | |||
| West Valley (East) V2 | 56.9 | 39.1 | 80.1 | |||
| SLC (Downtown) V2 | 105.8 | 78.5 | 139.6 | |||
| SLC (Southeast Liberty) | 112.0 | 75.6 | 159.7 | |||
| South Salt Lake | 55.6 | 32.2 | 89.5 | |||
| SLC (Sugar House) | 78.9 | 56.1 | 108.0 | |||
| Millcreek (South) | 87.7 | 61.2 | 121.8 | |||
| Millcreek (East) | 114.3 | 84.4 | 151.4 | |||
| Holladay V2 | 118.9 | 89.4 | 155.1 | |||
| Cottonwood | 109.3 | 88.8 | 133.1 | |||
| Kearns V2 | 68.2 | 42.5 | 103.9 | |||
| Taylorsville (E)/Murray (W) | 71.4 | 50.7 | 97.8 | |||
| Taylorsville (West) | 82.3 | 59.0 | 111.7 | |||
| Murray | 85.3 | 62.2 | 114.0 | |||
| Midvale | 115.5 | 84.0 | 155.0 | |||
| West Jordan (Northeast) V2 | 82.7 | 54.2 | 120.9 | |||
| West Jordan (Southeast) | 94.8 | 64.6 | 134.2 | |||
| West Jordan (W)/Copperton | 78.6 | 49.2 | 119.2 | |||
| South Jordan V2 | 169.1 | 136.3 | 207.4 | |||
| Daybreak | 189.5 | 129.0 | 268.6 | |||
| Sandy (West) | 108.8 | 78.9 | 146.3 | |||
| Sandy (Center) V2 | 110.2 | 80.5 | 147.2 | |||
| Sandy (Northeast) | 112.8 | 84.0 | 148.2 | |||
| Sandy (Southeast) | 158.3 | 125.5 | 197.0 | |||
| Draper | 148.0 | 112.8 | 190.8 | |||
| Riverton/Bluffdale | 124.7 | 94.8 | 161.1 | |||
| Herriman | 99.4 | 67.4 | 141.2 | |||
| Tooele County (Other) | 103.4 | 63.7 | 158.7 | |||
| Tooele Valley | 119.8 | 94.2 | 150.1 | |||
| Eagle Mountain/Cedar Valley | 82.4 | 48.4 | 131.1 | |||
| Lehi | 131.4 | 100.0 | 169.5 | |||
| Saratoga Springs | 111.0 | 70.9 | 165.7 | |||
| American Fork | 165.1 | 131.1 | 205.3 | |||
| Alpine | 147.0 | 92.5 | 221.8 | |||
| Pleasant Grove/Lindon | 136.5 | 107.5 | 170.9 | |||
| Orem (North) | 137.5 | 100.6 | 183.7 | |||
| Orem (West) | 131.2 | 98.0 | 172.2 | |||
| Orem (East) | 141.8 | 103.3 | 189.9 | |||
| Provo/BYU | 133.9 | 102.6 | 171.7 | |||
| Provo (West City Center) | 86.0 | 52.9 | 131.9 | |||
| Provo (East City Center) | 84.0 | 39.5 | 156.3 | |||
| Salem City | 144.2 | 89.2 | 220.4 | |||
| Spanish Fork | 137.1 | 101.5 | 181.0 | |||
| Springville | 124.7 | 91.2 | 166.6 | |||
| Mapleton | 181.3 | 117.3 | 267.7 | |||
| Utah County (South) V2 | 124.5 | 72.4 | 199.5 | |||
| Payson | 129.6 | 92.4 | 176.7 | |||
| Park City | 158.4 | 124.6 | 198.5 | |||
| Summit County (East) | 102.7 | 62.4 | 159.4 | |||
| Wasatch County | 155.7 | 121.9 | 195.9 | |||
| Daggett and Uintah County | 109.0 | 80.8 | 143.9 | |||
| Duchesne County | 124.6 | 87.9 | 171.6 | |||
| Nephi/Mona | 126.8 | 71.5 | 207.9 | |||
| Delta/Fillmore | 167.0 | 112.3 | 239.0 | |||
| Sanpete Valley | 71.2 | 45.4 | 106.4 | |||
| Central (Other) | 120.2 | 91.2 | 155.7 | |||
| Richfield/Monroe/Salina | 114.5 | 77.7 | 162.7 | |||
| Carbon County | 135.5 | 101.3 | 177.4 | |||
| Emery County | 134.4 | 86.8 | 198.6 | |||
| Grand County | 113.1 | 72.0 | 169.2 | |||
| Blanding/Monticello | 165.6 | 101.4 | 255.1 | |||
| San Juan County (Other) | 40.4 | 10.1 | 107.8 | |||
| St. George | 142.7 | 125.0 | 162.2 | |||
| Washington Co (Other) V2 | 89.8 | 58.8 | 131.4 | |||
| Washington City | 159.3 | 124.3 | 201.1 | |||
| Hurricane/La Verkin | 115.9 | 86.6 | 151.9 | |||
| Ivins/Santa Clara | 119.5 | 86.2 | 161.4 | |||
| Cedar City | 139.1 | 110.2 | 173.2 | |||
| Southwest LHD (Other) | 96.9 | 72.6 | 126.7 | |||
| State of Utah | 125.9 | 122.4 | 129.4 | |||
Data Notes
Age adjusted to the U.S. 2000 standard population.Data Source
Cancer data provided by the Utah Cancer Registry, supported by the National Cancer Institute (HHSN261201800016I), the U.S. Center for Disease Control and Prevention (NU58DP0063200), the University of Utah, and Huntsman Cancer Foundation| age Group | Incidence per 100,000 males | Lower Limit | Upper Limit | |||
|---|---|---|---|---|---|---|
Record Count: 3 | ||||||
| <45 | 0.7 | 0.4 | 1.1 | |||
| 45-64 | 180.5 | 172.1 | 189.3 | |||
| 65+ | 677.1 | 654.7 | 700.0 | |||
Data Notes
Crude rates displayed [[br]] *Age group <45 does not include ages 0-14Data Source
Cancer data provided by the Utah Cancer Registry, supported by the National Cancer Institute (HHSN261201800016I), the U.S. Center for Disease Control and Prevention (NU58DP0063200), the University of Utah, and Huntsman Cancer FoundationReferences and Community Resources
Cancer Information Service: [http://www.cancer.gov][[br]] American Cancer Society: [http://www.cancer.org][[br]] National Cancer Institute: [http://www.cancer.gov][[br]] Huntsman Cancer Institute: [http://www.huntsmancancer.org][[br]] Utah Cancer Control Program: [http://www.cancerutah.org][[br]] Utah Cancer Action Network: [http://www.ucan.cc][[br]]More Resources and Links
Evidence-based community health improvement ideas and interventions may be found at the following sites:- Centers for Disease Control and Prevention (CDC) WONDER Database, a system for disseminating public health data and information.
- United States Census Bureau data dashboard.
- Utah healthy Places Index, evidence-based and peer-reviewed tool, supports efforts to prioritize equitable community investments, develop critical programs and policies across the state, and much more.
- County Health Rankings
- Kaiser Family Foundation's StateHealthFacts.org
- Medical literature can be queried at PubMed library.
Page Content Updated On 01/06/2023,
Published on 02/07/2023


