Complete Health Indicator Report of Physical Activity: Recommended Aerobic Activity Among Adults
Definition
Percentage of adults aged 18 years and older who meet aerobic physical activity recommendations of getting at least 150 minutes per week of moderate-intensity activity, or 75 minutes of vigorous-intensity activity, or an equivalent combination of moderate-vigorous intensity activity.Numerator
Percentage of adults aged 18 years and older who report they participate in aerobic physical activity recommendations of getting at least 150 minutes per week of moderate-intensity activity, or 75 minutes of vigorous-intensity activity, or an equivalent combination of moderate-vigorous intensity activity.Denominator
Number of surveyed adults aged 18 years and older.Data Interpretation Issues
The wording for this question changed in 2011 and trend data should be interpreted with that change in mind. Prior to 2011, the definition of this indicator was "Percentage of adults aged 18 years and older who report light or moderate physical activity for at least 30 minutes five or more times per week or who report vigorous physical activity for at least 20 minutes three or more times per week." To reduce bias and more accurately represent population data, the BRFSS has changed survey methodology. In 2010, it began conducting surveys by cellular phone in addition to landline phones. It also adopted "iterative proportional fitting" (raking) as its weighting method. More details about these changes can be found at: [https://ibis.health.utah.gov/pdf/opha/resource/brfss/RakingImpact2011.pdf]. See also https://ibis.health.utah.gov/ibisph-view/pdf/opha/resource/brfss/RakingImpact2011.pdfWhy Is This Important?
Physical activity protects independently against cardiovascular disease. Physical activity has been shown to reduce the risk of some cancers, type 2 diabetes, stroke, and heart disease. Physical activity improves general physical and mental health. Regular physical activity helps to relieve pain from osteoarthritis. Regular physical activity is also known to improve effective disorders such as depression and anxiety, and increase quality of life and independent living among the elderly. Physical inactivity is a leading cause of premature death and also results in greater occurrence of illness.Healthy People Objective PA-2.1:
Increase the proportion of adults who engage in aerobic physical activity of at least moderate intensity for at least 150 minutes/week, or 75 minutes/week of vigorous intensity, or an equivalent combinationU.S. Target: 47.9 percent
Other Objectives
Utah's 42 Community Health Indicators[[br]] CSTE Chronic Disease IndicatorsHow Are We Doing?
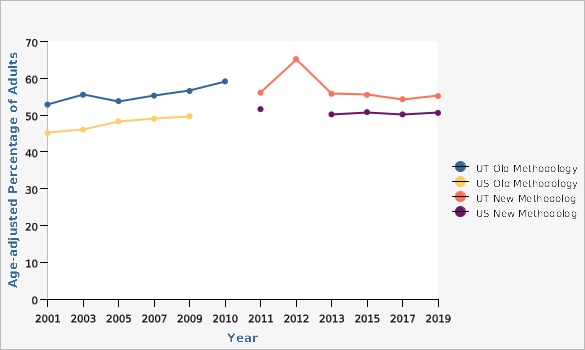
The Healthy People 2020 (HP2020) U.S. target for recommended aerobic physical activity is 47.9%. This target has been reached both in Utah and nationwide. Using the identical age categories for the U.S. rate as used in HP2020, the age-adjusted rate for Utah was 55.2%.How Do We Compare With the U.S.?
Compared to the nation, Utahns are more physically active. Data from 2019 show that 55.2% of Utah adults reported getting the recommended amount of aerobic physical activity (age-adjusted). Nationally, the 2019 rate was 50.6%.What Is Being Done?
The Utah Department of Health's, Healthy Environments Active Living program plays a key role in improving the health of residents in the state of Utah. The program was formed in July 2013 (as EPICC), through a new funding opportunity from the Centers of Disease Control and Prevention (CDC) that allowed for the merging of three previously existing programs: the Heart Disease and Stroke Prevention Program, the Diabetes Prevention and Control Program, and the Physical Activity, Nutrition and Obesity Program, as well as the addition of a school health program. The Healthy Environments Active Living Program was recently restructured as part of this strategic planning process and the new program model focuses on working together with staff and partners to address the social determinants of health while advancing health equity and increasing policy, systems and environment changes. HEAL works: In Schools:[[br]] 1) Schools are encouraged to adopt the Comprehensive School Physical Activity Program. This framework encourages students to be physically active for 60 minutes a day through school, home, and community activities.[[br]] 2) Height and weight trends are being tracked in a sample of elementary students to monitor Utah students.[[br]] 3) Action for Healthy Kids brings partners together to improve nutrition and physical activity environments in Utah's schools by implementing the school-based state plan strategies, working with local school boards to improve or develop policies for nutritious foods in schools. This includes recommendations for healthy vending options. In Worksites:[[br]] 1) The Utah Council for Worksite Health Promotion recognizes businesses that offer employee fitness and health promotion programs.[[br]] 2) HEAL offers a training on developing worksite wellness programs called Work@Health. HEAL also partners with local health departments to encourage worksites to complete the CDC Scorecard and participate in yearly health risk assessment for their employees. HEAL provides toolkits and other resources for employers interested in implementing wellness programs through the [http://heal.health.utah.gov heal.health.utah.gov] website: [https://heal.health.utah.gov/worksite-wellness/] In Communities:[[br]] 1) Local health departments (LHDs) receive federal funding to partner with schools, worksites, and other community based organizations to increase access to fresh fruits and vegetables through Eat Well Utah, farmers markets and retail stores. LHDs also work with cities within their jurisdictions to create a built environment that encourages physical activity. In Healthcare:[[br]] 1) HEAL works with health care systems to establish community clinical linkages to support individuals at risk for or diagnosed with diabetes or hypertension to engage in lifestyle change programs such as chronic disease self-management and diabetes prevention programs. In Childcare:[[br]] 1) Ten local health departments statewide have implemented the TOP Star program, which aims to improve the nutrition, physical activity, and breastfeeding environments and achieve best practice in child care centers and homes.[[br]] 2) HEAL works with state and local partners through the Childcare Obesity Prevention workgroup to implement policy and systems changes in early care and education across agencies statewide.Evidence-based Practices
The HEAL program promotes evidence-based practices collected by the Center TRT. The Center for Training and Research Translation (Center TRT) bridges the gap between research and practice and supports the efforts of public health practitioners working in nutrition, physical activity, and obesity prevention by: *Reviewing evidence of public health impact and disseminating population-level interventions; *Designing and providing practice-relevant training both in-person and web-based; *Addressing social determinants of health and health equity through training and translation efforts; and, *Providing guidance on evaluating policies and programs aimed at impacting healthy eating and physical activity.[[br]] [[br]] Appropriate evidence based interventions can be found at:[[br]] [http://www.centertrt.org/?p=interventions_interventions_overview]Available Services
Visit [http://heal.health.utah.gov] for more information. Walk to School Day; Safe Routes to School - for more information, call (801) 538-9362 Information of Worksite Wellness programs [https://heal.health.utah.gov/worksite-wellness/]Health Program Information
The Cancer Control Program at the Utah Department of Health is also promoting physical activity by assisting communities develop and implement bicycle and pedestrian master plans. The HEAL Program's Overarching Goals: Healthy People: Increase access to resources that empower all people in Utah to reach their full health potential. Healthy Communities: Increase the capacity of communities to support and promote healthy living for all individuals. Equitable Society: Increase opportunities for people who are under-resourced and under-represented in Utah to live healthy and thriving lives.Related Indicators
Relevant Population Characteristics
There are age, gender, and socio-economic related risk factors associated with physical activity.Related Relevant Population Characteristics Indicators:
- Utah Population Characteristics: Age Distribution of the Population
- Utah Population Characteristics: Education Level in the Population
- Obesity Among Adults
- Overweight or Obese
- Physical Activity: Recommended Muscle-strengthening Among Adults
- Utah Population Characteristics: Racial and Ethnic Composition of the Population
Health Care System Factors
Health care system factors relate primarily to access to care and a reported low rate of health care provider counseling for physical activity recommendations.Related Health Care System Factors Indicators:
Risk Factors
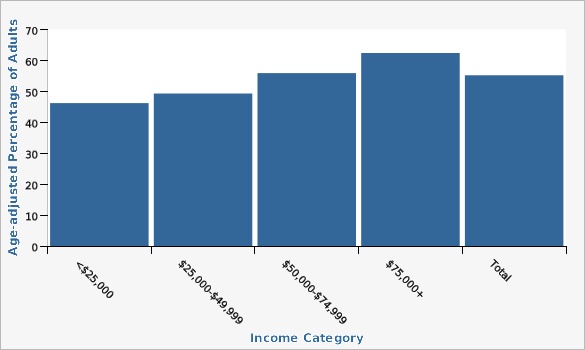
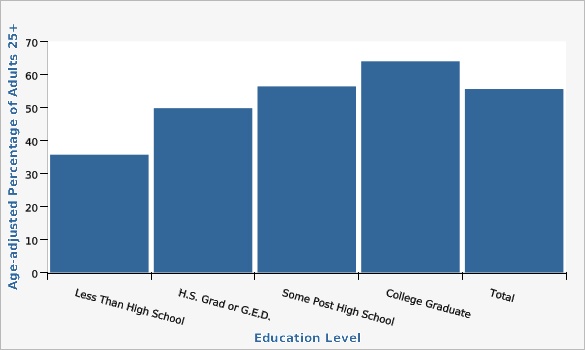
The percentage of persons who reported getting the recommended amount of physical activity is lower among adults with lower levels of income and education.Related Risk Factors Indicators:
Health Status Outcomes
Small changes in levels of physical activity such as walking or gardening can lead to big improvements in personal health. In fact, the greatest benefits occur among those who have never exercised regularly. Even moderate amounts of exercise can substantially reduce an individual's chance of dying from heart disease, cancer, or other causes.Related Health Status Outcomes Indicators:
Graphical Data Views
In 2019, Utah had a higher rate (55.2%) of meeting recommended amount of aerobic physical activity compared the U.S. rate (50.6%).
Physical activity questions are generally asked in odd years only. Utah added the questions for the 2012 BRFSS. Changes to the questionnaire in 2012 may have had an effect on the 2012 rate for Utah.
| BRFSS Utah vs. U.S. | Year | Age-adjusted Percentage of Adults | Lower Limit | Upper Limit | ||
|---|---|---|---|---|---|---|
Record Count: 22 | ||||||
| UT Old Methodology | 2001 | 52.8% | 50.7% | 55.0% | ||
| UT Old Methodology | 2003 | 55.5% | 53.5% | 57.6% | ||
| UT Old Methodology | 2005 | 53.8% | 52.1% | 55.5% | ||
| UT Old Methodology | 2007 | 55.3% | 53.5% | 57.1% | ||
| UT Old Methodology | 2009 | 56.6% | 55.2% | 57.9% | ||
| UT Old Methodology | 2010 | 59.2% | 55.5% | 62.7% | ||
| US Old Methodology | 2001 | 45.1% | 44.7% | 45.5% | ||
| US Old Methodology | 2003 | 46.0% | 45.6% | 46.4% | ||
| US Old Methodology | 2005 | 48.3% | 48.0% | 48.7% | ||
| US Old Methodology | 2007 | 49.0% | 48.7% | 49.4% | ||
| US Old Methodology | 2009 | 49.7% | 49.4% | 50.1% | ||
| UT New Methodology | 2011 | 56.1% | 54.9% | 57.2% | ||
| UT New Methodology | 2012 | 65.2% | 63.2% | 67.1% | ||
| UT New Methodology | 2013 | 55.8% | 54.6% | 56.9% | ||
| UT New Methodology | 2015 | 55.5% | 54.3% | 56.7% | ||
| UT New Methodology | 2017 | 54.3% | 53.1% | 55.6% | ||
| UT New Methodology | 2019 | 55.2% | 54.1% | 56.4% | ||
| US New Methodology | 2011 | 51.6% | 51.3% | 51.9% | ||
| US New Methodology | 2013 | 50.2% | 49.8% | 50.5% | ||
| US New Methodology | 2015 | 50.8% | 50.5% | 51.1% | ||
| US New Methodology | 2017 | 50.2% | 49.9% | 50.6% | ||
| US New Methodology | 2019 | 50.6% | 50.2% | 50.9% | ||
Data Notes
In 2016, Utah BRFSS modified its methodology for age adjustment for increased precision. With this change Utah is consistent with both the U.S. and other states using IBIS. Data has been updated from 2011 onward in all chart views to reflect this change. In 2011, the BRFSS changed its methodology from a landline only sample and weighting based on post-stratification to a landline/cell phone sample and raking as the weighting methodology. Raking accounts for variables such as income, education, marital status, and home ownership during weighting and has the potential to more accurately reflect the population distribution. For more information about raking, see https://ibis.health.utah.gov/ibisph-view/pdf/opha/resource/brfss/RakingImpact2011.pdf Due to changes in both sampling and the wording of the questions in 2011, data for 2011 forward should not be compared to previous years. Age-adjusted to U.S. 2000 population.Data Sources
- The Utah Department of Health and Human Services Behavioral Risk Factor Surveillance System (BRFSS)
- Behavioral Risk Factor Surveillance System Survey Data, US Department of Health and Human Services Centers for Disease Control and Prevention (CDC).
Recommended Amount of Aerobic Physical Activity by Gender and Age Group, Utah Adults Aged 18+ (Crude Rates), 2019
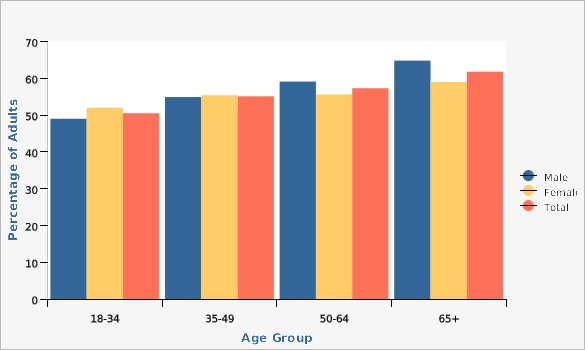
The percentage of adults engaging in the recommended amount of aerobic activity increases with age for both males and females.
| Males vs. Females | Age Group | Percentage of Adults | Lower Limit | Upper Limit | ||
|---|---|---|---|---|---|---|
Record Count: 12 | ||||||
| Male | 18-34 | 49.0% | 45.9% | 52.1% | ||
| Male | 35-49 | 54.9% | 51.5% | 58.2% | ||
| Male | 50-64 | 59.1% | 55.7% | 62.4% | ||
| Male | 65+ | 64.8% | 61.6% | 67.9% | ||
| Female | 18-34 | 52.0% | 48.6% | 55.4% | ||
| Female | 35-49 | 55.4% | 52.2% | 58.5% | ||
| Female | 50-64 | 55.6% | 52.2% | 58.9% | ||
| Female | 65+ | 59.0% | 56.0% | 62.0% | ||
| Total | 18-34 | 50.5% | 48.1% | 52.8% | ||
| Total | 35-49 | 55.1% | 52.8% | 57.4% | ||
| Total | 50-64 | 57.3% | 54.9% | 59.7% | ||
| Total | 65+ | 61.8% | 59.6% | 63.9% | ||
Data Notes
In 2016, Utah BRFSS modified its methodology for age adjustment for increased precision. With this change Utah is consistent with both the U.S. and other states using IBIS. Data has been updated from 2011 onward in all chart views to reflect this change.Data Source
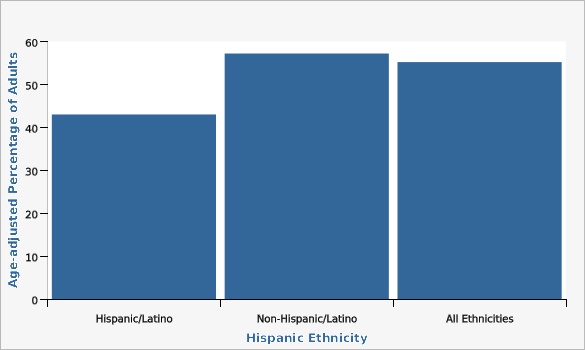
The Utah Department of Health and Human Services Behavioral Risk Factor Surveillance System (BRFSS)Non-Hispanic adults have higher rates of meeting the recommended amount of aerobic physical activity than Hispanic adults.
| Hispanic Ethnicity | Age-adjusted Percentage of Adults | Lower Limit | Upper Limit | |||
|---|---|---|---|---|---|---|
Record Count: 3 | ||||||
| Hispanic/Latino | 43.0% | 38.9% | 47.1% | |||
| Non-Hispanic/Latino | 57.2% | 56.0% | 58.4% | |||
| All Ethnicities | 55.2% | 54.1% | 56.4% | |||
Data Notes
In 2016, Utah BRFSS modified its methodology for age adjustment for increased precision. With this change Utah is consistent with both the U.S. and other states using IBIS. Data has been updated from 2011 onward in all chart views to reflect this change. Age-adjusted to the U.S. 2000 standard population.Data Source
The Utah Department of Health and Human Services Behavioral Risk Factor Surveillance System (BRFSS)| Race/Ethnicity | Age-adjusted Percentage of Adults | Lower Limit | Upper Limit | |||
|---|---|---|---|---|---|---|
Record Count: 7 | ||||||
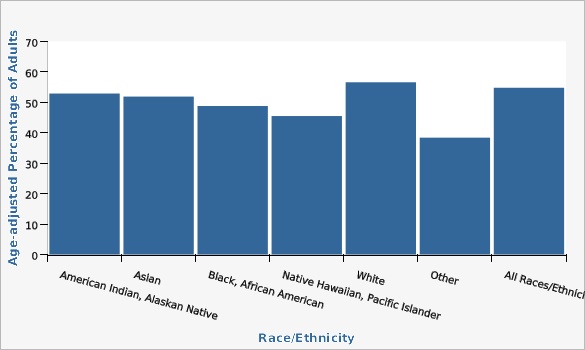
| American Indian, Alaskan Native | 52.9% | 45.9% | 59.9% | |||
| Asian | 51.9% | 43.3% | 60.4% | |||
| Black, African American | 48.8% | 39.3% | 58.4% | |||
| Native Hawaiian, Pacific Islander | 45.5% | 34.0% | 57.5% | |||
| White | 56.6% | 55.7% | 57.5% | |||
| Other | 38.4% | 34.8% | 42.2% | |||
| All Races/Ethnicities | 54.8% | 53.9% | 55.6% | |||
Data Notes
In 2016, Utah BRFSS modified its methodology for age adjustment for increased precision. With this change Utah is consistent with both the U.S. and other states using IBIS. Data has been updated from 2011 onward in all chart views to reflect this change. Age-adjusted to the U.S. 2000 standard population based on 3 age groups: 18-34, 35-49, and 50+.Data Source
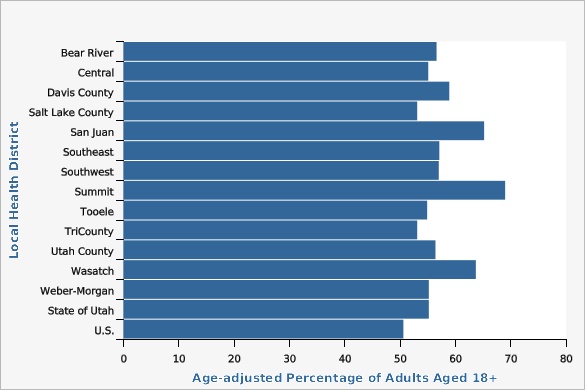
The Utah Department of Health and Human Services Behavioral Risk Factor Surveillance System (BRFSS)Summit County Local Health District had a statistically significantly higher rate than the state, and Salt Lake County had a statistically significantly lower rate.
| Local Health District | Age-adjusted Percentage of Adults Aged 18+ | Lower Limit | Upper Limit | Note | ||
|---|---|---|---|---|---|---|
Record Count: 15 | ||||||
| Bear River | 56.6% | 51.9% | 61.2% | |||
| Central | 55.1% | 49.5% | 60.6% | |||
| Davis County | 58.9% | 55.2% | 62.4% | |||
| Salt Lake County | 53.1% | 50.9% | 55.2% | Lower than the state | ||
| San Juan | 65.2% | 53.7% | 75.2% | |||
| Southeast | 57.1% | 49.8% | 64.1% | |||
| Southwest | 57.0% | 52.7% | 61.2% | |||
| Summit | 69.0% | 60.6% | 76.3% | Higher than the state | ||
| Tooele | 54.9% | 48.5% | 61.0% | |||
| TriCounty | 53.1% | 47.0% | 59.1% | |||
| Utah County | 56.4% | 53.9% | 58.9% | |||
| Wasatch | 63.7% | 55.1% | 71.4% | |||
| Weber-Morgan | 55.2% | 51.1% | 59.3% | |||
| State of Utah | 55.2% | 54.1% | 56.4% | |||
| U.S. | 50.6% | 50.2% | 50.9% | |||
Data Notes
In 2016, Utah BRFSS modified its methodology for age adjustment for increased precision. With this change Utah is consistent with both the U.S. and other states using IBIS. Data has been updated from 2011 onward in all chart views to reflect this change. Age-adjusted to U.S. 2000 standard population.Data Source
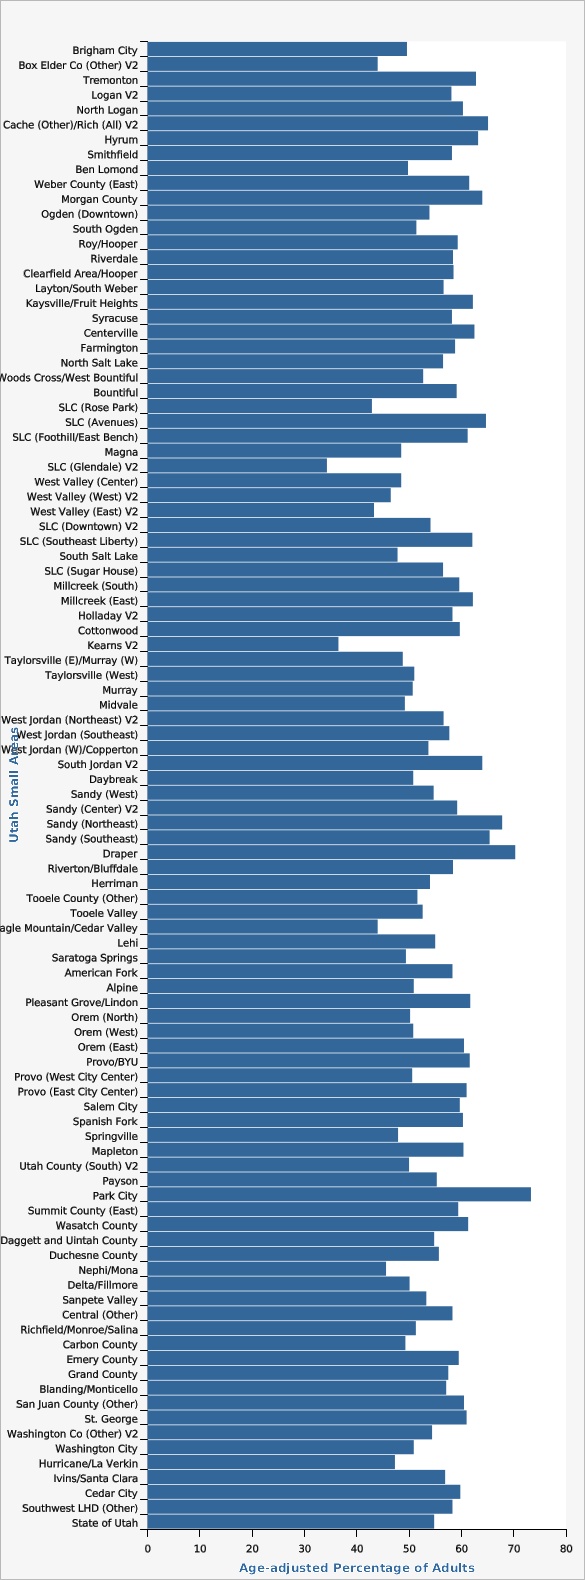
The Utah Department of Health and Human Services Behavioral Risk Factor Surveillance System (BRFSS)The highest rate of physical activity was seen for Park City (73.3%) and the lowest was for Glendale V2 (34.3%).
| Utah Small Areas | Age-adjusted Percentage of Adults | Lower Limit | Upper Limit | Note | ||
|---|---|---|---|---|---|---|
Record Count: 100 | ||||||
| Brigham City | 49.6% | 40.1% | 59.1% | |||
| Box Elder Co (Other) V2 | 44.0% | 33.4% | 55.2% | |||
| Tremonton | 62.8% | 51.6% | 72.7% | |||
| Logan V2 | 58.1% | 51.6% | 64.2% | |||
| North Logan | 60.3% | 50.2% | 69.5% | |||
| Cache (Other)/Rich (All) V2 | 65.1% | 55.6% | 73.5% | Higher than the state | ||
| Hyrum | 63.2% | 47.2% | 76.8% | |||
| Smithfield | 58.2% | 45.3% | 70.0% | |||
| Ben Lomond | 49.8% | 43.7% | 56.0% | |||
| Weber County (East) | 61.5% | 53.8% | 68.7% | |||
| Morgan County | 64.0% | 51.8% | 74.6% | |||
| Ogden (Downtown) | 53.9% | 46.1% | 61.5% | |||
| South Ogden | 51.4% | 43.8% | 58.8% | |||
| Roy/Hooper | 59.3% | 52.2% | 66.0% | |||
| Riverdale | 58.4% | 49.0% | 67.2% | |||
| Clearfield Area/Hooper | 58.5% | 52.4% | 64.4% | |||
| Layton/South Weber | 56.6% | 51.2% | 61.9% | |||
| Kaysville/Fruit Heights | 62.2% | 54.2% | 69.6% | |||
| Syracuse | 58.2% | 48.1% | 67.7% | |||
| Centerville | 62.5% | 51.9% | 72.1% | |||
| Farmington | 58.8% | 49.6% | 67.4% | |||
| North Salt Lake | 56.5% | 45.1% | 67.2% | |||
| Woods Cross/West Bountiful | 52.7% | 39.4% | 65.6% | |||
| Bountiful | 59.1% | 52.0% | 65.9% | |||
| SLC (Rose Park) | 42.9% | 34.0% | 52.3% | Lower than the state | ||
| SLC (Avenues) | 64.7% | 54.3% | 73.8% | |||
| SLC (Foothill/East Bench) | 61.2% | 50.2% | 71.1% | |||
| Magna | 48.5% | 39.3% | 57.7% | |||
| SLC (Glendale) V2 | 34.3% | 24.5% | 45.8% | Lower than the state | ||
| West Valley (Center) | 48.5% | 41.1% | 56.0% | |||
| West Valley (West) V2 | 46.5% | 37.4% | 55.8% | |||
| West Valley (East) V2 | 43.3% | 35.7% | 51.4% | Lower than the state | ||
| SLC (Downtown) V2 | 54.1% | 45.9% | 62.2% | |||
| SLC (Southeast Liberty) | 62.1% | 50.9% | 72.2% | |||
| South Salt Lake | 47.8% | 38.9% | 56.8% | |||
| SLC (Sugar House) | 56.5% | 48.9% | 63.8% | |||
| Millcreek (South) | 59.6% | 49.5% | 69.0% | |||
| Millcreek (East) | 62.2% | 51.2% | 72.0% | |||
| Holladay V2 | 58.3% | 48.1% | 67.8% | |||
| Cottonwood | 59.7% | 51.2% | 67.7% | |||
| Kearns V2 | 36.5% | 28.5% | 45.4% | Lower than the state | ||
| Taylorsville (E)/Murray (W) | 48.8% | 40.6% | 57.0% | |||
| Taylorsville (West) | 51.0% | 42.9% | 59.1% | |||
| Murray | 50.7% | 41.8% | 59.5% | |||
| Midvale | 49.2% | 39.3% | 59.2% | |||
| West Jordan (Northeast) V2 | 56.6% | 46.1% | 66.5% | |||
| West Jordan (Southeast) | 57.7% | 50.0% | 65.1% | |||
| West Jordan (W)/Copperton | 53.7% | 44.2% | 62.9% | |||
| South Jordan V2 | 64.0% | 56.1% | 71.1% | Higher than the state | ||
| Daybreak | 50.8% | 41.1% | 60.5% | |||
| Sandy (West) | 54.7% | 44.7% | 64.3% | |||
| Sandy (Center) V2 | 59.2% | 50.5% | 67.5% | |||
| Sandy (Northeast) | 67.8% | 55.8% | 77.8% | Higher than the state | ||
| Sandy (Southeast) | 65.4% | 55.4% | 74.2% | Higher than the state | ||
| Draper | 70.3% | 61.7% | 77.7% | Higher than the state | ||
| Riverton/Bluffdale | 58.4% | 50.4% | 65.9% | |||
| Herriman | 54.0% | 46.0% | 61.7% | |||
| Tooele County (Other) | 51.6% | 42.4% | 60.7% | |||
| Tooele Valley | 52.6% | 47.3% | 57.9% | |||
| Eagle Mountain/Cedar Valley | 44.0% | 35.2% | 53.2% | Lower than the state | ||
| Lehi | 55.0% | 48.4% | 61.4% | |||
| Saratoga Springs | 49.4% | 39.9% | 58.9% | |||
| American Fork | 58.3% | 51.6% | 64.8% | |||
| Alpine | 50.9% | 37.1% | 64.6% | |||
| Pleasant Grove/Lindon | 61.7% | 55.5% | 67.4% | Higher than the state | ||
| Orem (North) | 50.2% | 42.4% | 58.0% | |||
| Orem (West) | 50.8% | 42.7% | 58.9% | |||
| Orem (East) | 60.5% | 50.6% | 69.6% | |||
| Provo/BYU | 61.6% | 54.6% | 68.3% | |||
| Provo (West City Center) | 50.6% | 41.2% | 60.0% | |||
| Provo (East City Center) | 61.0% | 51.3% | 69.9% | |||
| Salem City | 59.7% | 45.7% | 72.2% | |||
| Spanish Fork | 60.3% | 52.8% | 67.3% | |||
| Springville | 47.9% | 39.7% | 56.1% | |||
| Mapleton | 60.4% | 49.6% | 70.4% | |||
| Utah County (South) V2 | 50.0% | 37.6% | 62.3% | |||
| Payson | 55.3% | 46.6% | 63.6% | |||
| Park City | 73.3% | 65.3% | 80.0% | Higher than the state | ||
| Summit County (East) | 59.4% | 50.7% | 67.5% | |||
| Wasatch County | 61.3% | 54.9% | 67.4% | Higher than the state | ||
| Daggett and Uintah County | 54.8% | 49.9% | 59.6% | |||
| Duchesne County | 55.7% | 48.7% | 62.5% | |||
| Nephi/Mona | 45.6% | 33.6% | 58.1% | |||
| Delta/Fillmore | 50.1% | 39.0% | 61.2% | |||
| Sanpete Valley | 53.3% | 45.2% | 61.3% | |||
| Central (Other) | 58.3% | 51.5% | 64.9% | |||
| Richfield/Monroe/Salina | 51.3% | 42.4% | 60.0% | |||
| Carbon County | 49.3% | 42.4% | 56.2% | |||
| Emery County | 59.5% | 50.6% | 67.9% | |||
| Grand County | 57.5% | 46.5% | 67.8% | |||
| Blanding/Monticello | 57.1% | 48.4% | 65.4% | |||
| San Juan County (Other) | 60.5% | 46.2% | 73.2% | |||
| St. George | 61.0% | 55.6% | 66.1% | Higher than the state | ||
| Washington Co (Other) V2 | 54.4% | 42.4% | 65.8% | |||
| Washington City | 50.9% | 41.4% | 60.2% | |||
| Hurricane/La Verkin | 47.3% | 36.2% | 58.7% | |||
| Ivins/Santa Clara | 56.9% | 41.2% | 71.2% | |||
| Cedar City | 59.8% | 52.8% | 66.5% | |||
| Southwest LHD (Other) | 58.3% | 49.6% | 66.6% | |||
| State of Utah | 54.8% | 53.9% | 55.7% | |||
Data Notes
In 2016, Utah BRFSS modified its methodology for age adjustment for increased precision. With this change Utah is consistent with both the U.S. and other states using IBIS. Data has been updated from 2011 onward in all chart views to reflect this change. Age-adjusted to U.S. 2000 standard population. A description of the Utah Small Areas may be found on the Methodology and Guidelines page: [https://ibis.health.utah.gov/resource/Guidelines.html].Data Source
The Utah Department of Health and Human Services Behavioral Risk Factor Surveillance System (BRFSS)Individuals in higher income categories had higher rates of engaging in the recommended amount of aerobic physical activity.
| Income Category | Age-adjusted Percentage of Adults | Lower Limit | Upper Limit | |||
|---|---|---|---|---|---|---|
Record Count: 5 | ||||||
| <$25,000 | 46.2% | 42.7% | 49.9% | |||
| $25,000-$49,999 | 49.3% | 46.3% | 52.3% | |||
| $50,000-$74,999 | 55.9% | 52.9% | 58.9% | |||
| $75,000+ | 62.4% | 60.5% | 64.3% | |||
| Total | 55.2% | 54.1% | 56.4% | |||
Data Notes
In 2016, Utah BRFSS modified its methodology for age adjustment for increased precision. With this change Utah is consistent with both the U.S. and other states using IBIS. Data has been updated from 2011 onward in all chart views to reflect this change. Age-adjusted to the U.S. 2000 standard population.Data Source
The Utah Department of Health and Human Services Behavioral Risk Factor Surveillance System (BRFSS)Individuals in higher education categories have higher rates of engaging in the recommended amount of aerobic physical activity.
| Education Level | Age-adjusted Percentage of Adults 25+ | Lower Limit | Upper Limit | |||
|---|---|---|---|---|---|---|
Record Count: 5 | ||||||
| Less Than High School | 35.7% | 30.4% | 41.4% | |||
| H.S. Grad or G.E.D. | 49.8% | 47.1% | 52.4% | |||
| Some Post High School | 56.4% | 54.2% | 58.5% | |||
| College Graduate | 64.0% | 62.3% | 65.7% | |||
| Total | 55.6% | 54.4% | 56.9% | |||
Data Notes
In 2016, Utah BRFSS modified its methodology for age adjustment for increased precision. With this change Utah is consistent with both the U.S. and other states using IBIS. Data has been updated from 2011 onward in all chart views to reflect this change. Age-adjusted to the U.S. 2000 standard population.Data Source
The Utah Department of Health and Human Services Behavioral Risk Factor Surveillance System (BRFSS)References and Community Resources
National Physical Activity Recommendations:[[br]] [http://www.health.gov/paguidelines/][[br]] [http://www.cdc.gov/physicalactivity/everyone/guidelines/index.html] CDC's Division of Nutrition, Physical Activity, and Obesity: [http://www.cdc.gov/nccdphp/dnpao] The National Heart, Lung, and Blood Institute has extensive resources on physical activity for patients, health care providers, and general consumers: [http://www.nhlbi.nih.gov] The CDC's Prevention Research Centers provide resources and information about physical activity to researchers, public health practitioners, and others who are interested in promoting physical activity in their communities: [http://www.cdc.gov/prc/] More information on the Behavioral Risk Factor Surveillance System may be found on the website of the Centers for Disease Control and Prevention - [http://www.cdc.gov/brfss/] References:[[br]] 1. Centers for Disease Control and Prevention. Physical activity and health: a report of the surgeon general. Atlanta (GA): U.S. Department of Health and Human Services, Centers for Disease Control and Prevention, National Center for Chronic Disease Prevention and Promotion; 1996.[[br]] 2. Knowler WC, Barrett-Connor E, Fowler SE, Hamman RF, Lachin JM, et al. Reduction in the incidence of type 2 diabetes with lifestyle intervention or metformin. N Engl J Med 2002;346(6):393-403.[[br]] 3. Kesaniemi, Y., et al. (1994). Dose-response issues concerning physical activity and health: an evidence-based symposium. Medicine and Science in Sports and Exercise, 33(6 suppl), S351-S358More Resources and Links
Evidence-based community health improvement ideas and interventions may be found at the following sites:- Centers for Disease Control and Prevention (CDC) WONDER Database, a system for disseminating public health data and information.
- United States Census Bureau data dashboard.
- Utah healthy Places Index, evidence-based and peer-reviewed tool, supports efforts to prioritize equitable community investments, develop critical programs and policies across the state, and much more.
- County Health Rankings
- Kaiser Family Foundation's StateHealthFacts.org
- Medical literature can be queried at PubMed library.
Page Content Updated On 10/29/2021,
Published on 11/14/2022

