Complete Health Indicator Report of Foodborne Illness - Campylobacter Infections
Definition
Campylobacteriosis is an infectious disease that is a leading cause of acute diarrheal illness worldwide. Symptoms can range from no symptoms to severe bloody diarrhea with symptoms similar to acute appendicitis. However, the most common symptoms are diarrhea, abdominal pain, malaise, fever, nausea, and vomiting. It is caused by a motile, gram negative bacteria of the genus ''Campylobacter''.Numerator
Number of culture-confirmed and probable cases of campylobacteriosis reported in Utah each year.Denominator
Total Utah population per year.Data Interpretation Issues
The rate reported is the number of cases in Utah per 100,000 population per year.Why Is This Important?
''Campylobacter'' is one of the most common bacterial causes of diarrheal illness in the United States. Most cases occur as isolated, sporadic events, and not as a part of a large outbreak. The majority of those infected will experience symptoms within 2-5 days after exposure to the bacteria, including diarrhea, severe abdominal cramping, and fever; this may be accompanied by nausea and vomiting. The illness typically lasts one week, but may be prolonged in some individuals and relapse can occur. Long-term complications are rare, but include reactive arthritis and Guillain-Barre Syndrome. All age groups can be infected by ''Campylobacter'' bacteria. The infection is acquired by eating or drinking food contaminated with ''Campylobacter'' bacteria. Illness may also be spread by direct contact with an infected person or animal. Farm animals, improperly cooked poultry, untreated water, and unpasteurized (raw) milk are the main sources of infection.How Are We Doing?
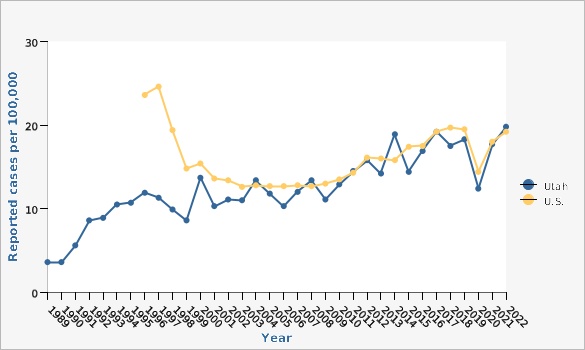
Campylobacteriosis became a reportable disease in Utah in 1983. Increases in number of campylobacteriosis cases per 100,000 population reported annually since 1983 may be due to better reporting and improved laboratory detection methods. The incidence of campylobacteriosis in 2022 was slightly higher than in years preceding the COVID-19 pandemic.How Do We Compare With the U.S.?
Active surveillance through FoodNet indicates that 19.2 cases were diagnosed in 2022 for each 100,000 persons in the U.S. population. The incidence in Utah during 2022 was similar, at 19.8 cases per 100,000 persons in the Utah population. Many cases go undiagnosed or unreported, and campylobacteriosis is estimated to affect over 2.4 million persons every year in the U.S., or 0.8% of the population. Campylobacteriosis has been a nationally notifiable disease since 2014.What Is Being Done?
Per the Communicable Disease Rule R386-702-3, health care providers and laboratories are required to report cases of ''Campylobacter'' to the Utah Department of Health and Human Services (DHHS) or a local health department and submit clinical material to the Utah Public Health Laboratory. The Disease Response, Evaluation, Analysis, and Monitoring Program at DHHS assists local health departments with the investigation of cases and outbreaks and implementation of control measures to prevent further cases. Local health departments make an attempt to interview every case of campylobacteriosis reported to public health. Information gathered during these interviews includes food history, water exposure, animal exposure, outdoor exposure, travel history, and contact with ill individuals. Data from these interviews are analyzed and used to identify outbreaks and common sources of infection. In addition, patients are provided with information on high risk exposures and how to prevent future campylobacteriosis infection in themselves and their families. Some general guidelines to prevent the spread of ''Campylobacter'' include the following: *Always refrigerate meat products. Never leave raw meat at room temperature. *Always cook meat completely. *Always cook raw eggs or foods containing raw eggs well. *Avoid using unpasteurized milk. *Carefully wash hands before and after preparing food. *Always wash hands with soap and warm water after using the toilet or changing diapers and make sure children wash their hands especially after using the toilet or handling pets. [[br]] Visit [http://www.cdc.gov/handwashing/] for proper hand washing technique.Available Services
Foodborne disease outbreaks and other outbreaks are investigated primarily by local health departments in collaboration with the Utah Department of Health and Human Services as needed.[[br]] [http://www.ualhd.org/]Related Indicators
Related Relevant Population Characteristics Indicators:
Graphical Data Views
Reported confirmed and probable campylobacteriosis cases by Year, Utah, 1989-2022

| Utah vs. U.S. | Year | Reported cases per 100,000 | ||||
|---|---|---|---|---|---|---|
Record Count: 61 | ||||||
| Utah | 1989 | 3.6 | ||||
| Utah | 1990 | 3.6 | ||||
| Utah | 1991 | 5.6 | ||||
| Utah | 1992 | 8.6 | ||||
| Utah | 1993 | 8.9 | ||||
| Utah | 1994 | 10.5 | ||||
| Utah | 1995 | 10.7 | ||||
| Utah | 1996 | 11.9 | ||||
| Utah | 1997 | 11.3 | ||||
| Utah | 1998 | 9.9 | ||||
| Utah | 1999 | 8.6 | ||||
| Utah | 2000 | 13.7 | ||||
| Utah | 2001 | 10.3 | ||||
| Utah | 2002 | 11.1 | ||||
| Utah | 2003 | 11.0 | ||||
| Utah | 2004 | 13.4 | ||||
| Utah | 2005 | 11.8 | ||||
| Utah | 2006 | 10.3 | ||||
| Utah | 2007 | 12.0 | ||||
| Utah | 2008 | 13.4 | ||||
| Utah | 2009 | 11.1 | ||||
| Utah | 2010 | 12.9 | ||||
| Utah | 2011 | 14.5 | ||||
| Utah | 2012 | 15.8 | ||||
| Utah | 2013 | 14.2 | ||||
| Utah | 2014 | 18.9 | ||||
| Utah | 2015 | 14.4 | ||||
| Utah | 2016 | 16.9 | ||||
| Utah | 2017 | 19.2 | ||||
| Utah | 2018 | 17.5 | ||||
| Utah | 2019 | 18.3 | ||||
| Utah | 2020 | 12.4 | ||||
| Utah | 2021 | 17.7 | ||||
| Utah | 2022 | 19.8 | ||||
| U.S. | 1996 | 23.6 | ||||
| U.S. | 1997 | 24.6 | ||||
| U.S. | 1998 | 19.4 | ||||
| U.S. | 1999 | 14.8 | ||||
| U.S. | 2000 | 15.4 | ||||
| U.S. | 2001 | 13.6 | ||||
| U.S. | 2002 | 13.4 | ||||
| U.S. | 2003 | 12.6 | ||||
| U.S. | 2004 | 12.8 | ||||
| U.S. | 2005 | 12.7 | ||||
| U.S. | 2006 | 12.7 | ||||
| U.S. | 2007 | 12.8 | ||||
| U.S. | 2008 | 12.7 | ||||
| U.S. | 2009 | 13.0 | ||||
| U.S. | 2010 | 13.5 | ||||
| U.S. | 2011 | 14.3 | ||||
| U.S. | 2012 | 16.1 | ||||
| U.S. | 2013 | 16.0 | ||||
| U.S. | 2014 | 15.8 | ||||
| U.S. | 2015 | 17.4 | ||||
| U.S. | 2016 | 17.5 | ||||
| U.S. | 2017 | 19.2 | ||||
| U.S. | 2018 | 19.7 | ||||
| U.S. | 2019 | 19.5 | ||||
| U.S. | 2020 | 14.4 | ||||
| U.S. | 2021 | 18.0 | ||||
| U.S. | 2022 | 19.2 | ||||
Data Notes
The Utah rates are derived from Utah annual surveillance reports.Data Sources
- Utah Department of Health and Human Services Office of Communicable Diseases
- For years 2020 and later, the population estimates are provided by the Kem C. Gardner Policy Institute, Utah state and county annual population estimates are by single year of age and sex, IBIS Version 2022
- Population Estimates for 2000-2019: National Center for Health Statistics (NCHS) through a collaborative agreement with the U.S. Census Bureau, IBIS Version 2020
- Population Estimates for 1999 and earlier: Utah Governor's Office of Planning and Budget
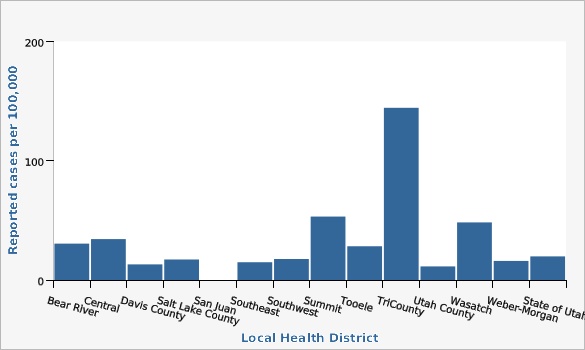
Reported confirmed and probable campylobacteriosis cases by local health district, Utah, 2022

| Local Health District | Reported cases per 100,000 | |||||
|---|---|---|---|---|---|---|
Record Count: 14 | ||||||
| Bear River | 30.5 | |||||
| Central | 34.3 | |||||
| Davis County | 13.1 | |||||
| Salt Lake County | 17.2 | |||||
| San Juan | 0.0 | |||||
| Southeast | 14.9 | |||||
| Southwest | 17.6 | |||||
| Summit | 53.2 | |||||
| Tooele | 28.3 | |||||
| TriCounty | 144.4 | |||||
| Utah County | 11.4 | |||||
| Wasatch | 48.3 | |||||
| Weber-Morgan | 16.0 | |||||
| State of Utah | 19.8 | |||||
Data Sources
- For years 2020 and later, the population estimates are provided by the Kem C. Gardner Policy Institute, Utah state and county annual population estimates are by single year of age and sex, IBIS Version 2022
- Utah Department of Health and Human Services Office of Communicable Diseases
References and Community Resources
[https://epi.health.utah.gov/][[br]] [https://www.cdc.gov/FoodNetFast]More Resources and Links
Evidence-based community health improvement ideas and interventions may be found at the following sites:- Centers for Disease Control and Prevention (CDC) WONDER Database, a system for disseminating public health data and information.
- United States Census Bureau data dashboard.
- Utah healthy Places Index, evidence-based and peer-reviewed tool, supports efforts to prioritize equitable community investments, develop critical programs and policies across the state, and much more.
- County Health Rankings
- Kaiser Family Foundation's StateHealthFacts.org
- Medical literature can be queried at PubMed library.
Page Content Updated On 02/08/2024,
Published on 03/06/2024
