Complete Health Indicator Report of Fall Injury (Unintentional)
Definition
The number of hospitalizations due to unintentional falls per 10,000 population. ICD-10: W00-W19.Numerator
Number of hospitalizations due to unintentional falls (ICD-10 codes: W00-W19).Denominator
Total number of persons in the population of Utah.Why Is This Important?
Falls are a leading cause of injury death for Utahns, especially those aged 65 and older. Additionally, in Utah, unintentional fall-related inpatient hospital charges for all ages totaled over $1.58 billion from 2016 to 2021.Other Objectives
{{style color:#1AA1B7 Healthy People 2030 Objective IVP-08:}}[[br]] Reduce fall-related deaths among older adults[[br]] '''U.S. Target:''' 6.34 deaths per 10,000 population Older adults are defined as adults aged 65 years or older.How Are We Doing?
Unintentional falls caused 457 unintentional fall-related deaths in Utah in 2022; 87.1% (398/457) of deaths were among Utahns aged 65 and older. In 2021, females aged 65 and older had a significantly higher crude rate of hospitalizations due to unintentional falls (117.5 per 10,000 population) than males aged 65 and older (74.4 per 10,000 population). Note: 2021 is the most current year for which data is available for hospitalizations. 2022 is the most current year for which data is available for deaths.How Do We Compare With the U.S.?
In 2021 in Utah, there were 19.1 hospitalizations due to unintentional falls for every 10,000 people (age-adjusted rate). This is significantly less than the U.S. age-adjusted rate of 32.0 hospitalizations per 10,000 people hospitalized due to unintentional falls in 2021.What Is Being Done?
The DHHS Violence and Injury Prevention Program (VIPP) receives funding from the U.S. Centers for Disease Control and Prevention to collect traumatic brain injury surveillance data, including a falls-specific data module, for the state of Utah. This is done through review of hospital discharge data, vital statistics data, and hospital records abstractions. Local health departments and other community-based agencies have implemented evidence-based falls prevention programs, such as the Stepping On program and Matter of Balance program. These programs work to increase strength and balance, reduce fall hazards in the home, and build self-efficacy among participants to reduce the fear of falling. National research shows the programs reduce falls among participants. The classes are free to the public. The Utah Falls Prevention Coalition was established by the VIPP in 2011 with the purpose of developing a strategic, statewide response to the growing rate of falls among older adults in the state. Until this time, there had been no single, statewide response to address this public health problem in Utah. Many organizations were implementing falls prevention activities but resources and activities were scattered and disconjointed when looked at from a public health perspective. The Coalition has three main purposes: 1) bring together partners who have an interest in falls prevention among older adults, 2) develop goals and strategies on falls prevention among older adults to include in the Utah Violence and Injury Plan, and 3) ready the state for future funding opportunities on falls prevention.Available Services
You can sign up for Stepping On classes near you at [https://healthyaging.utah.gov/] [[br]] Contact your local health department or senior center for more information on available classes.Health Program Information
The DHHS Violence and Injury Prevention Program (VIPP) is a trusted and comprehensive resource for data related to violence and injury. Through education, this information helps promote partnerships and programs to prevent injuries and improve public health.Related Indicators
Relevant Population Characteristics
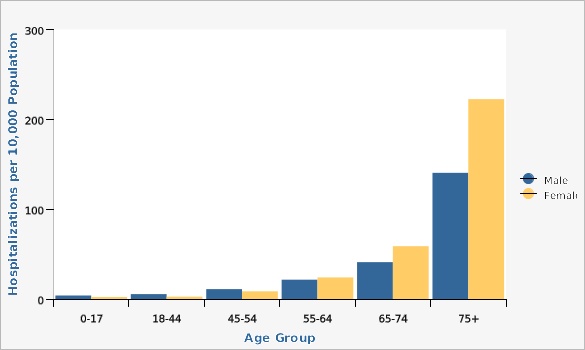
Unintentional fall-related hospitalizations are highest among Utahns 65 years of age and older. Women are injured more often from falls than men, but men die more often from their injuries.Related Relevant Population Characteristics Indicators:
Risk Factors
Risk factors for falls include older age, poor eyesight, lack of regular exercise, poor nutrition, substance abuse and smoking, and misuse of medications. Some medications can cause drowsiness or dizziness and some drugs can interact with other medications or alcohol and cause problems that may lead to falling. In addition, certain health conditions can increase the risk of falls including osteoporosis, arthritis, clinical depression, dementia, and neurological or musculoskeletal disorders like Parkinson's and Alzheimer's disease. In the home environmental hazards such as poor lighting, lack of grab bars and handrails, slippery or wet surfaces, uneven floors and surfaces, clutter, and loose throw rugs are factors in many falls.Related Risk Factors Indicators:
- Utah Population Characteristics: Age Distribution of the Population
- Alcohol Consumption - Binge Drinking
- Alzheimer's Disease and Related Dementias
- Arthritis and poor mental health
- Arthritis prevalence
- Smoking Among Adults
- Smoking Among Adolescents
- Depression: Adult Prevalence
- Health status: mental health past 30 days
- Physical Activity: Recommended Aerobic Activity Among Adults
- Physical Activity Among Adolescents
- Physical Activity: Recommended Muscle-strengthening Among Adults
- Physical Inactivity
- Drug Overdose and Poisoning Incidents
- Substance Abuse (Alcohol or Marijuana) - Adolescents
Health Status Outcomes
Falls are the leading cause of death and injury disability among Utahns 65 years of age and older. Falls account for more than 95% of hip fractures and are the leading cause of traumatic brain and spinal cord injuries among seniors. Among people ages 75 and older, those who fall are four to five times more likely to be admitted to a long-term care facility for a year or longer. Nearly one in four elderly Utahns will die of complications from a hip fracture within one year of the injury. Source: U.S. Centers for Disease Control and PreventionRelated Health Status Outcomes Indicators:
Graphical Data Views
Unintentional fall injury hospitalization rates are higher the older a person gets. Females had higher rates than males for the older age groups.
| Males vs. Females | Age Group | Hospitalizations per 10,000 Population | Lower Limit | Upper Limit | ||
|---|---|---|---|---|---|---|
Record Count: 12 | ||||||
| Male | 0-17 | 3.9 | 3.6 | 4.2 | ||
| Male | 18-44 | 5.4 | 5.2 | 5.7 | ||
| Male | 45-54 | 11.0 | 10.3 | 11.7 | ||
| Male | 55-64 | 21.5 | 20.5 | 22.6 | ||
| Male | 65-74 | 41.0 | 39.3 | 42.8 | ||
| Male | 75+ | 140.4 | 136.4 | 144.6 | ||
| Female | 0-17 | 2.2 | 2.0 | 2.4 | ||
| Female | 18-44 | 2.6 | 2.4 | 2.8 | ||
| Female | 45-54 | 8.6 | 7.9 | 9.2 | ||
| Female | 55-64 | 24.0 | 23.0 | 25.2 | ||
| Female | 65-74 | 58.8 | 56.8 | 60.8 | ||
| Female | 75+ | 222.5 | 217.9 | 227.2 | ||
Data Sources
- Utah Inpatient Hospital Discharge Data, Healthcare Information & Analysis Programs, Office of Research & Evaluation, Utah Department of Health and Human Services
- Population Estimates for 2000-2019: National Center for Health Statistics (NCHS) through a collaborative agreement with the U.S. Census Bureau, IBIS Version 2020
- For years 2020 and later, the population estimates are provided by the Kem C. Gardner Policy Institute, Utah state and county annual population estimates are by single year of age and sex, IBIS Version 2022
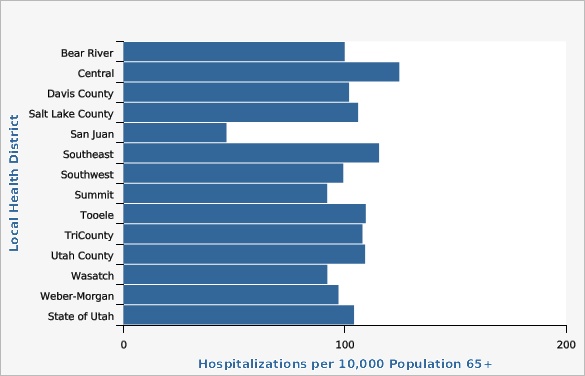
Unintentional Fall Injury Hospitalizations Among Adults 65+ by Local Health District, Utah, 2017-2021

| Local Health District | Hospitalizations per 10,000 Population 65+ | Lower Limit | Upper Limit | |||
|---|---|---|---|---|---|---|
Record Count: 14 | ||||||
| Bear River | 100.0 | 94.0 | 106.3 | |||
| Central | 124.7 | 116.0 | 133.8 | |||
| Davis County | 102.0 | 97.4 | 106.7 | |||
| Salt Lake County | 106.0 | 103.6 | 108.6 | |||
| San Juan | 46.6 | 34.3 | 61.7 | |||
| Southeast | 115.5 | 104.6 | 127.3 | |||
| Southwest | 99.3 | 95.5 | 103.3 | |||
| Summit | 92.1 | 81.2 | 104.0 | |||
| Tooele | 109.5 | 98.6 | 121.3 | |||
| TriCounty | 108.0 | 97.1 | 119.8 | |||
| Utah County | 109.2 | 105.1 | 113.4 | |||
| Wasatch | 92.1 | 79.4 | 106.3 | |||
| Weber-Morgan | 97.2 | 92.5 | 102.0 | |||
| State of Utah | 104.2 | 102.7 | 105.7 | |||
Data Sources
- Utah Inpatient Hospital Discharge Data, Healthcare Information & Analysis Programs, Office of Research & Evaluation, Utah Department of Health and Human Services
- Population Estimates for 2000-2019: National Center for Health Statistics (NCHS) through a collaborative agreement with the U.S. Census Bureau, IBIS Version 2020
- For years 2020 and later, the population estimates are provided by the Kem C. Gardner Policy Institute, Utah state and county annual population estimates are by single year of age and sex, IBIS Version 2022
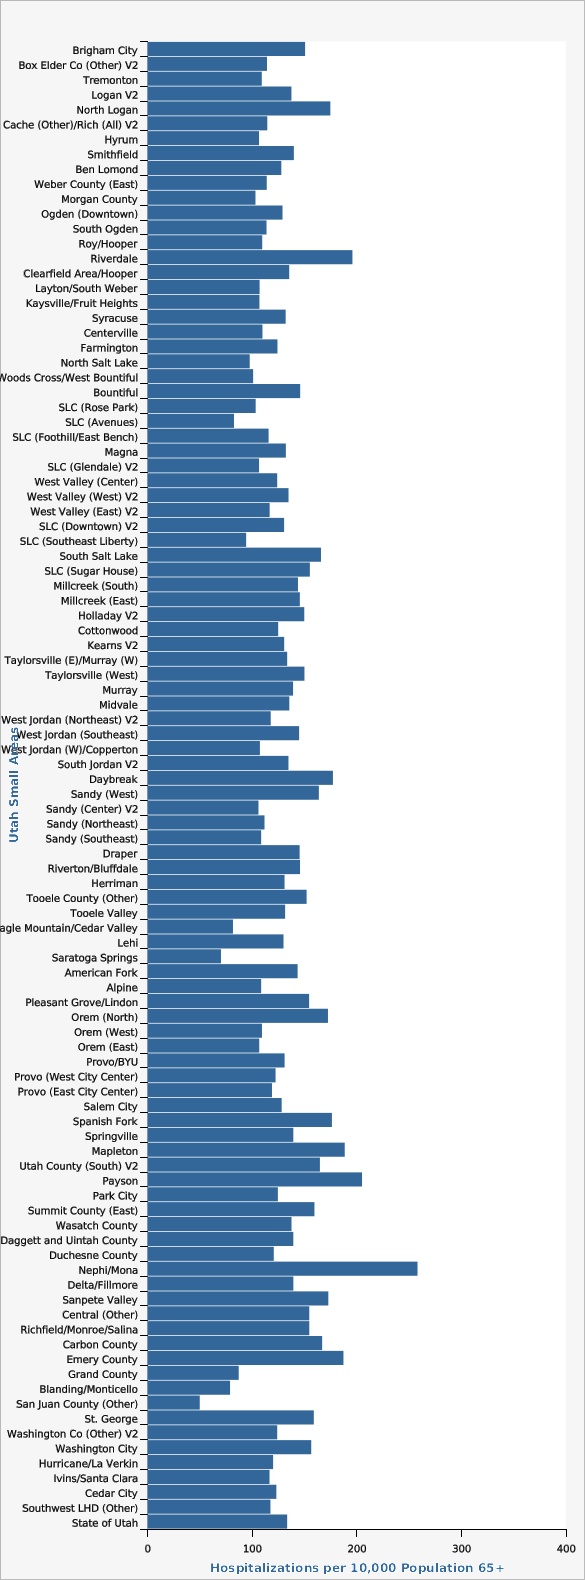
| Utah Small Areas | Hospitalizations per 10,000 Population 65+ | Lower Limit | Upper Limit | |||
|---|---|---|---|---|---|---|
Record Count: 100 | ||||||
| Brigham City | 150.6 | 132.9 | 170.1 | |||
| Box Elder Co (Other) V2 | 114.2 | 92.2 | 139.9 | |||
| Tremonton | 109.2 | 89.5 | 132.0 | |||
| Logan V2 | 137.6 | 123.4 | 153.0 | |||
| North Logan | 174.8 | 150.1 | 202.3 | |||
| Cache (Other)/Rich (All) V2 | 114.5 | 98.0 | 133.0 | |||
| Hyrum | 106.6 | 76.8 | 144.1 | |||
| Smithfield | 139.9 | 114.2 | 169.7 | |||
| Ben Lomond | 127.9 | 116.4 | 140.2 | |||
| Weber County (East) | 114.0 | 101.8 | 127.2 | |||
| Morgan County | 103.2 | 81.4 | 129.0 | |||
| Ogden (Downtown) | 129.0 | 113.9 | 145.7 | |||
| South Ogden | 113.8 | 101.3 | 127.3 | |||
| Roy/Hooper | 109.6 | 97.4 | 123.0 | |||
| Riverdale | 195.9 | 176.5 | 216.8 | |||
| Clearfield Area/Hooper | 135.5 | 121.8 | 150.2 | |||
| Layton/South Weber | 107.1 | 97.4 | 117.5 | |||
| Kaysville/Fruit Heights | 107.0 | 93.1 | 122.4 | |||
| Syracuse | 132.0 | 110.5 | 156.6 | |||
| Centerville | 109.9 | 92.9 | 129.1 | |||
| Farmington | 124.2 | 104.2 | 146.9 | |||
| North Salt Lake | 97.7 | 78.0 | 120.8 | |||
| Woods Cross/West Bountiful | 101.0 | 78.7 | 127.6 | |||
| Bountiful | 145.9 | 134.6 | 158.0 | |||
| SLC (Rose Park) | 103.4 | 88.4 | 120.3 | |||
| SLC (Avenues) | 82.7 | 70.7 | 96.0 | |||
| SLC (Foothill/East Bench) | 115.8 | 100.7 | 132.4 | |||
| Magna | 132.2 | 111.4 | 155.9 | |||
| SLC (Glendale) V2 | 106.6 | 87.3 | 129.0 | |||
| West Valley (Center) | 124.0 | 110.8 | 138.2 | |||
| West Valley (West) V2 | 134.8 | 113.4 | 159.1 | |||
| West Valley (East) V2 | 116.7 | 103.6 | 131.1 | |||
| SLC (Downtown) V2 | 130.6 | 115.4 | 147.1 | |||
| SLC (Southeast Liberty) | 94.3 | 78.3 | 112.6 | |||
| South Salt Lake | 165.8 | 145.3 | 188.4 | |||
| SLC (Sugar House) | 155.2 | 140.3 | 171.2 | |||
| Millcreek (South) | 143.8 | 128.0 | 161.1 | |||
| Millcreek (East) | 145.6 | 129.6 | 163.0 | |||
| Holladay V2 | 149.8 | 135.7 | 165.1 | |||
| Cottonwood | 124.9 | 114.5 | 136.0 | |||
| Kearns V2 | 130.6 | 112.7 | 150.6 | |||
| Taylorsville (E)/Murray (W) | 133.5 | 119.2 | 149.1 | |||
| Taylorsville (West) | 150.0 | 135.1 | 166.1 | |||
| Murray | 139.1 | 125.0 | 154.4 | |||
| Midvale | 135.6 | 119.3 | 153.4 | |||
| West Jordan (Northeast) V2 | 117.8 | 101.9 | 135.5 | |||
| West Jordan (Southeast) | 144.9 | 126.8 | 164.8 | |||
| West Jordan (W)/Copperton | 107.4 | 88.6 | 164.8 | |||
| South Jordan V2 | 134.7 | 120.6 | 150.1 | |||
| Daybreak | 177.2 | 152.0 | 205.5 | |||
| Sandy (West) | 163.8 | 146.1 | 183.0 | |||
| Sandy (Center) V2 | 106.1 | 91.9 | 121.8 | |||
| Sandy (Northeast) | 111.8 | 98.2 | 126.9 | |||
| Sandy (Southeast) | 108.6 | 95.5 | 123.1 | |||
| Draper | 145.4 | 128.0 | 164.5 | |||
| Riverton/Bluffdale | 145.8 | 129.0 | 164.2 | |||
| Herriman | 131.0 | 111.1 | 153.4 | |||
| Tooele County (Other) | 152.1 | 128.0 | 179.4 | |||
| Tooele Valley | 131.6 | 117.6 | 146.7 | |||
| Eagle Mountain/Cedar Valley | 81.7 | 61.9 | 105.8 | |||
| Lehi | 130.0 | 114.6 | 146.9 | |||
| Saratoga Springs | 70.2 | 53.6 | 90.4 | |||
| American Fork | 143.5 | 128.1 | 160.2 | |||
| Alpine | 108.6 | 83.5 | 139.0 | |||
| Pleasant Grove/Lindon | 154.5 | 139.2 | 171.0 | |||
| Orem (North) | 172.5 | 152.8 | 194.0 | |||
| Orem (West) | 109.4 | 94.5 | 126.0 | |||
| Orem (East) | 106.8 | 91.5 | 124.0 | |||
| Provo/BYU | 131.0 | 117.4 | 145.8 | |||
| Provo (West City Center) | 122.4 | 102.7 | 144.8 | |||
| Provo (East City Center) | 119.0 | 91.4 | 152.2 | |||
| Salem City | 128.2 | 100.9 | 160.7 | |||
| Spanish Fork | 176.3 | 156.2 | 198.2 | |||
| Springville | 139.4 | 121.6 | 159.1 | |||
| Mapleton | 188.5 | 154.0 | 228.4 | |||
| Utah County (South) V2 | 164.8 | 132.8 | 202.1 | |||
| Payson | 205.1 | 181.2 | 231.3 | |||
| Park City | 124.6 | 109.0 | 141.9 | |||
| Summit County (East) | 159.6 | 132.2 | 190.9 | |||
| Wasatch County | 137.6 | 121.4 | 155.5 | |||
| Daggett and Uintah County | 139.4 | 123.4 | 156.8 | |||
| Duchesne County | 120.7 | 102.2 | 141.6 | |||
| Nephi/Mona | 258.1 | 216.2 | 305.7 | |||
| Delta/Fillmore | 139.4 | 114.6 | 168.1 | |||
| Sanpete Valley | 172.8 | 151.5 | 196.3 | |||
| Central (Other) | 154.6 | 137.9 | 172.8 | |||
| Richfield/Monroe/Salina | 154.6 | 128.8 | 173.1 | |||
| Carbon County | 166.9 | 148.1 | 187.5 | |||
| Emery County | 187.3 | 157.8 | 220.8 | |||
| Grand County | 87.2 | 69.0 | 108.6 | |||
| Blanding/Monticello | 78.9 | 57.6 | 105.6 | |||
| San Juan County (Other) | 49.9 | 30.9 | 76.3 | |||
| St. George | 159.0 | 150.9 | 167.4 | |||
| Washington Co (Other) V2 | 124.0 | 105.7 | 144.6 | |||
| Washington City | 156.5 | 140.2 | 174.1 | |||
| Hurricane/La Verkin | 120.0 | 106.0 | 135.5 | |||
| Ivins/Santa Clara | 116.6 | 100.4 | 134.7 | |||
| Cedar City | 123.2 | 110.1 | 137.3 | |||
| Southwest LHD (Other) | 117.5 | 104.7 | 131.4 | |||
| State of Utah | 133.5 | 131.8 | 135.2 | |||
Data Sources
- Utah Inpatient Hospital Discharge Data, Healthcare Information & Analysis Programs, Office of Research & Evaluation, Utah Department of Health and Human Services
- Population estimates used linear interpolation of U.S. Census Bureau, Kem C. Gardner Policy Institute population estimates, and ESRI ZIP Code data provided annual population estimates for ZIP Code areas by sex and age groups, IBIS Version 2022
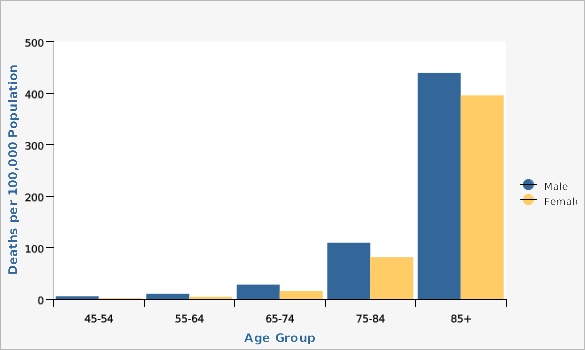
Deaths due to falls significantly increase as people age due to increased frailty and decreased response to environmental risks that lead to falls. With each increase in 10-year age group, the rate increases 3-4 times accordingly.
Males are generally more likely than females to pass away due to a fall.
| Males vs. Females | Age Group | Deaths per 100,000 Population | Lower Limit | Upper Limit | Numer- ator | Denom- inator |
|---|---|---|---|---|---|---|
Record Count: 10 | ||||||
| Male | 45-54 | 5.3 | 3.9 | 7.1 | 46 | 864,035 |
| Male | 55-64 | 10.0 | 7.9 | 12.6 | 76 | 758,199 |
| Male | 65-74 | 27.9 | 23.7 | 32.7 | 154 | 551,900 |
| Male | 75-84 | 109.2 | 96.6 | 123.0 | 271 | 248,183 |
| Male | 85+ | 439.0 | 394.6 | 486.9 | 358 | 81,558 |
| Female | 45-54 | 1.7 | 0.9 | 2.8 | 14 | 840,296 |
| Female | 55-64 | 4.4 | 3.0 | 6.1 | 34 | 778,770 |
| Female | 65-74 | 15.6 | 12.6 | 19.1 | 93 | 595,439 |
| Female | 75-84 | 81.4 | 71.5 | 92.3 | 243 | 298,569 |
| Female | 85+ | 395.5 | 360.7 | 432.8 | 473 | 119,594 |
Data Notes
ICD-10 codes include W00-W19.Data Sources
- Utah Death Certificate Database, Office of Vital Records and Statistics, Utah Department of Health and Human Services
- Population Estimates for 2000-2019: National Center for Health Statistics (NCHS) through a collaborative agreement with the U.S. Census Bureau, IBIS Version 2020
- For years 2020 and later, the population estimates are provided by the Kem C. Gardner Policy Institute, Utah state and county annual population estimates are by single year of age and sex, IBIS Version 2022
References and Community Resources
Utah Department of Health and Human Services, News, "Falls are Leading Cause of Injury-related Death for Older Utahns" [[br]] [https://dhhs.utah.gov/featured-news/falls-are-leading-cause-of-injury-related-death-for-older-utahns/] Centers for Disease Control and Prevention, WISQARS: Web-based Injury Statistics Query and Reporting System [[br]] [https://www.cdc.gov/injury/wisqars/index.html] Centers for Disease Control and Prevention, Center for Injury Prevention & Control [[br]] [https://www.cdc.gov/injury/index.html]More Resources and Links
Evidence-based community health improvement ideas and interventions may be found at the following sites:- Centers for Disease Control and Prevention (CDC) WONDER Database, a system for disseminating public health data and information.
- United States Census Bureau data dashboard.
- Utah healthy Places Index, evidence-based and peer-reviewed tool, supports efforts to prioritize equitable community investments, develop critical programs and policies across the state, and much more.
- County Health Rankings
- Kaiser Family Foundation's StateHealthFacts.org
- Medical literature can be queried at PubMed library.
Page Content Updated On 02/27/2024,
Published on 02/27/2024


