Complete Health Indicator Report of Electronic Cigarettes / Vape Products
Definition
__Youth experimentation with electronic cigarettes:__ percentage of students in grades 8, 10, 12 who have used electronic cigarettes in their lifetime. __Current use of electronic cigarettes among youth:__ percentage of students in grades 8, 10, 12 who have used electronic cigarettes in the past 30 days. __Current use of electronic cigarettes among adults:__ percentage of adults (age 18+) who currently use electronic cigarettes every day or some days.Numerator
__Youth experimentation with electronic cigarettes:__ number of students in grades 8, 10, and 12 who have used electronic cigarettes in their lifetime. __Current use of electronic cigarettes among youth:__ number of students in grades 8, 10, and 12 who have used electronic cigarettes in the past 30 days. __Current use of electronic cigarettes among adults:__ number of adults (age 18+) who currently use electronic cigarettes every day or some days.Denominator
__Experimentation and current use of electronic cigarettes among youth:__ number of all students in grades 8, 10, and 12 surveyed. __Current use of electronic cigarettes among adults:__ number of adults (age 18+)Data Interpretation Issues
The Prevention Needs Assessment (PNA) is the main component of Utah's School Health And Risk Prevention (SHARP) survey project. It is conducted in odd years with Utah students in grades 6, 8, 10, and 12. The Behavioral Risk Factor Surveillance System (BRFSS) survey is conducted with a representative sample of non-institutionalized Utah adults living in households with a landline telephone. In 2010, the BRFSS added cell phone interviews to the survey protocol and introduced a new weighting methodology that better represents populations of low socioeconomic status. More details about these changes can be found at: [https://ibis.health.utah.gov/pdf/opha/resource/brfss/RakingImpact2011.pdf]. Due to these changes survey results from the years before 2010 are not comparable to results observed in 2010 or later. The 2010 estimated adult smoking rate was higher compared to rates from previous years that were based on post-stratification by age, sex, and local health district. As with all telephone surveys, data may be subject to error as resulting from non-coverage (e.g., lower telephone coverage among some low SES populations), non-response (e.g., refusal to participate in the survey or answer specific questions), or measurement (e.g. social desirability or recall bias). Interviewer training and monitoring and strict adherence to good survey research protocols reduce error from these sources.Why Is This Important?
Electronic cigarettes or vape products are battery-powered devices that turn liquids into aerosol. They are marketed under a variety of different names but are most commonly referred to as electronic cigarettes, e-cigarettes, vape products, mods, or tanks. They may also be known as JUUL, Vuse, Suorin, MarkTen, and Blu. The liquids frequently contain nicotine and flavors. Since 2011, Utah has seen a sharp increase in vape product experimentation and use among youth and young adults. Given the uncertain public health impact of vaping and the potential for increasing nicotine addiction among young people, monitoring the use of vape products and enforcing and strengthening policies that regulate youth access are public health priorities for Utah.Other Objectives
Currently, Healthy People 2020 does not list a specific objective related to electronic cigarettes. TU-3 focuses on reducing the initiation of tobacco use among children, adolescents, and young adults.How Are We Doing?
From 2011 to 2019, the rate of vape product use among Utah students in grades 8, 10, and 12 increased from 1.9% to 12.4% (Utah SHARP - Prevention Needs Assessment 2011-2019). In 2021, 7.8% of Utah students in grades 8, 10, and 12 (Utah SHARP - Prevention Needs Assessment), and 9.7% of Utah high school students reported that they vaped in the past 30 days (Utah YRBS). In comparison, 6.8% of Utah adults reported current use of vape products in 2020 (Utah BRFSS 2020).How Do We Compare With the U.S.?
In 2021, 9.7% of Utah high school students reported that they had used e-cigarettes or vape products in the past 30 days (Utah YRBS). In comparison, the 2021 National Youth Tobacco Survey (NYTS) reports that 11.3% of U.S. high school students used e-cigarettes/vape products in the past 30 days.What Is Being Done?
Utah has passed a number of policies that limit youth access and/or regulate the safety of vape products. Tobacco retailers are required to be licensed through the Utah Tax Commission to sell electronic cigarettes and other vape products. The sale of vape products to those younger than 21 years is prohibited. Most flavored products can only be sold in tobacco retail specialty stores. Since vape products are included in the Utah Indoor Clean Air Act, vaping in indoor public places is also prohibited. These measures are intended to reduce youth vaping and nicotine addiction.Evidence-based Practices
Evidence-based practices for smoking cessation include individual, group, and telephone counseling and use of FDA-approved nicotine replacement therapies and medications.Available Services
For services and information on tobacco use and quitting, visit Utah's online tobacco cessation website, [http://waytoquit.org waytoquit.org], or call the Utah Tobacco Quitline at 1-800-QUIT-NOW. Utah quit services include the teen tobacco cessation program My Life My Quit.Health Program Information
Tobacco and vape industry claims that e-cigarettes are effective smoking cessation tools have not been verified by research studies. For information on quitting tobacco use with proven methods, visit [http://waytoquit.org waytoquit.org] or call the Utah Tobacco Quitline at 1-800-QUIT-NOW. To receive more information about the health effects of vaping, addiction, and quitting visit [https://seethroughthevape.org/].Related Indicators
Related Relevant Population Characteristics Indicators:
Related Risk Factors Indicators:
Graphical Data Views
Electronic Cigarettes Experimentation and Current Use by Grade, Utah Students in Grades 8, 10, and 12, 2021
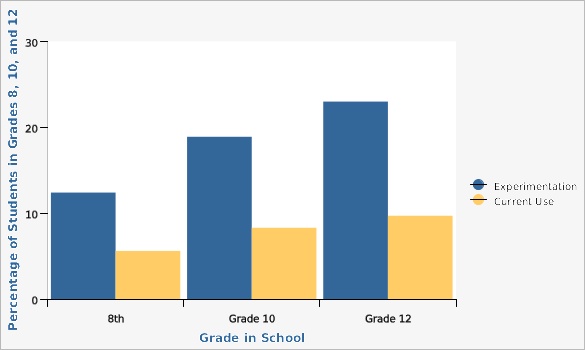
| Experimentation and Current Use | Grade in School | Percentage of Students in Grades 8, 10, and 12 | Lower Limit | Upper Limit | ||
|---|---|---|---|---|---|---|
Record Count: 6 | ||||||
| Experimentation | 8th | 12.4% | 10.8% | 14.3% | ||
| Experimentation | Grade 10 | 18.9% | 16.9% | 21.1% | ||
| Experimentation | Grade 12 | 23.0% | 21.0% | 25.1% | ||
| Current Use | 8th | 5.6% | 4.6% | 6.8% | ||
| Current Use | Grade 10 | 8.3% | 7.3% | 9.4% | ||
| Current Use | Grade 12 | 9.7% | 8.4% | 11.1% | ||
Data Notes
Experimentation is defined as "ever tried"; current use is defined as use in the past 30 days.Data Source
Prevention Needs Assessment SurveyElectronic Cigarettes Current Vape Product Use by Sex and Year, Utah Students Grades 9-12, 2017-2021
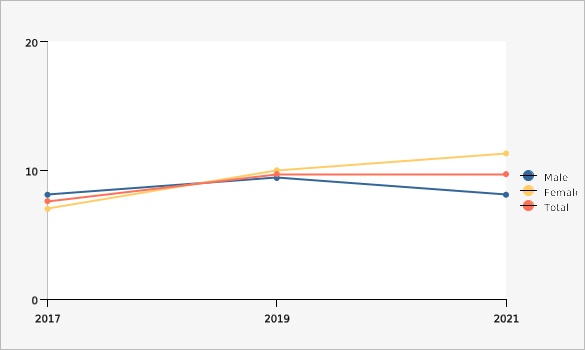
Data Notes
Source: Youth Risk Behavior Survey (YRBS) [https://ibis.health.utah.gov/ibisph-view/query/builder/yrbs/ElecVapor/ElecVapor.html]Data Source
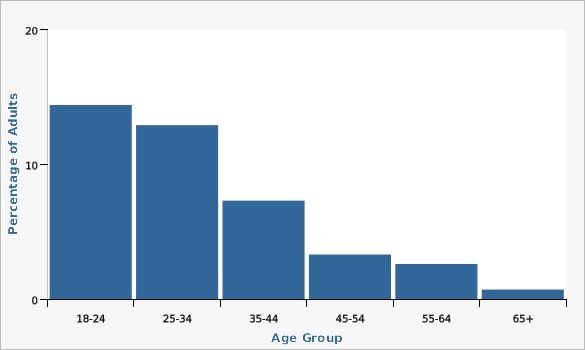
The Utah Department of Health and Human Services Youth Risk Behavior Surveillance System (YRBSS)| Age Group | Percentage of Adults | Lower Limit | Upper Limit | Note | ||
|---|---|---|---|---|---|---|
Record Count: 6 | ||||||
| 18-24 | 14.4% | 11.8% | 17.3% | |||
| 25-34 | 12.9% | 10.9% | 15.2% | |||
| 35-44 | 7.3% | 5.9% | 9.0% | |||
| 45-54 | 3.3% | 2.5% | 4.5% | |||
| 55-64 | 2.6% | 1.8% | 3.9% | |||
| 65+ | 0.7% | 0.4% | 1.3% | * | ||
Data Notes
Current use is defined as use in currently using "every day" or "some days."[[br]]Data Source
The Utah Department of Health and Human Services Behavioral Risk Factor Surveillance System (BRFSS)Electronic Cigarettes Current Use by Local Health District, Utah Students in Grades 8, 10, and 12, 2021
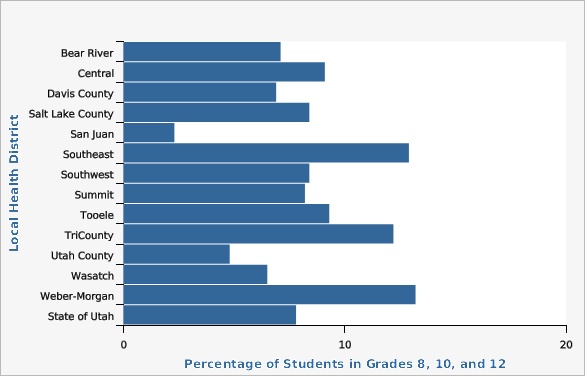
| Local Health District | Percentage of Students in Grades 8, 10, and 12 | Lower Limit | Upper Limit | |||
|---|---|---|---|---|---|---|
Record Count: 14 | ||||||
| Bear River | 7.1% | 5.8% | 8.7% | |||
| Central | 9.1% | 7.2% | 11.3% | |||
| Davis County | 6.9% | 5.7% | 8.3% | |||
| Salt Lake County | 8.4% | 6.9% | 10.0% | |||
| San Juan | 2.3% | 0.6% | 8.7% | |||
| Southeast | 12.9% | 9.6% | 17.2% | |||
| Southwest | 8.4% | 6.6% | 10.7% | |||
| Summit | 8.2% | 7.1% | 9.6% | |||
| Tooele | 9.3% | 8.1% | 10.5% | |||
| TriCounty | 12.2% | 9.8% | 15.1% | |||
| Utah County | 4.8% | 4.1% | 5.7% | |||
| Wasatch | 6.5% | 4.3% | 9.7% | |||
| Weber-Morgan | 13.2% | 11.0% | 15.7% | |||
| State of Utah | 7.8% | 7.2% | 8.4% | |||
Data Notes
Current use is defined as use in the past 30 days.Data Source
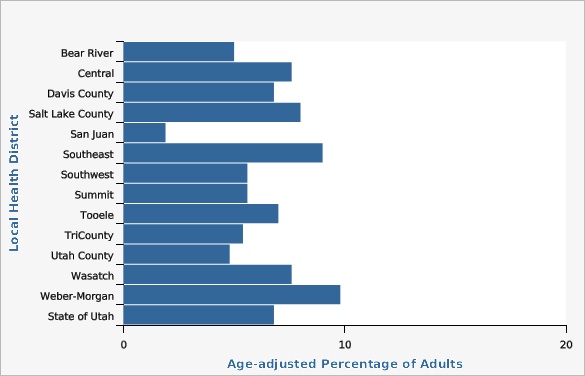
Prevention Needs Assessment Survey| Local Health District | Age-adjusted Percentage of Adults | Lower Limit | Upper Limit | Note | ||
|---|---|---|---|---|---|---|
Record Count: 14 | ||||||
| Bear River | 5.0% | 3.6% | 6.8% | |||
| Central | 7.6% | 5.4% | 10.8% | |||
| Davis County | 6.8% | 5.4% | 8.5% | |||
| Salt Lake County | 8.0% | 7.2% | 8.9% | |||
| San Juan | 1.9% | 0.7% | 4.9% | * | ||
| Southeast | 9.0% | 6.0% | 13.1% | |||
| Southwest | 5.6% | 4.1% | 7.7% | |||
| Summit | 5.6% | 3.3% | 9.2% | |||
| Tooele | 7.0% | 4.9% | 9.9% | |||
| TriCounty | 5.4% | 3.5% | 8.1% | |||
| Utah County | 4.8% | 4.0% | 5.8% | |||
| Wasatch | 7.6% | 4.3% | 13.0% | |||
| Weber-Morgan | 9.8% | 8.0% | 12.0% | |||
| State of Utah | 6.8% | 6.4% | 7.3% | |||
Data Notes
Age-adjusted to U.S. 2000 population.[[br]] * For San Juan Health District, the estimate has a coefficient of variation >30% and is therefore deemed unreliable by Utah Department of Health standards.Data Source
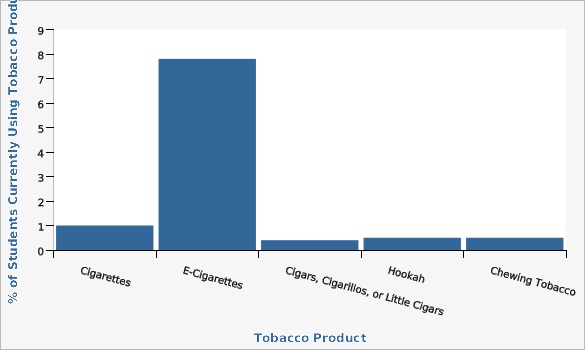
The Utah Department of Health and Human Services Behavioral Risk Factor Surveillance System (BRFSS)| Tobacco Product | % of Students Currently Using Tobacco Products | Lower Limit | Upper Limit | |||
|---|---|---|---|---|---|---|
Record Count: 5 | ||||||
| Cigarettes | 1.0% | 0.8% | 1.1% | |||
| E-Cigarettes | 7.8% | 7.1% | 8.4% | |||
| Cigars, Cigarillos, or Little Cigars | 0.4% | 0.3% | 0.5% | |||
| Hookah | 0.5% | 0.4% | 0.7% | |||
| Chewing Tobacco | 0.5% | 0.4% | 0.6% | |||
Data Notes
Current use is defined as use in the past 30 days.Data Source
Prevention Needs Assessment SurveyMore Resources and Links
Evidence-based community health improvement ideas and interventions may be found at the following sites:- Centers for Disease Control and Prevention (CDC) WONDER Database, a system for disseminating public health data and information.
- United States Census Bureau data dashboard.
- Utah healthy Places Index, evidence-based and peer-reviewed tool, supports efforts to prioritize equitable community investments, develop critical programs and policies across the state, and much more.
- County Health Rankings
- Kaiser Family Foundation's StateHealthFacts.org
- Medical literature can be queried at PubMed library.
Page Content Updated On 10/24/2022,
Published on 12/20/2022

