Complete Health Indicator Report of Cancer Deaths
Definition
The rate of death from all cancers per 100,000 persons.Numerator
Number of deaths due to cancer (ICD-10 codes C00-C97).Denominator
Population of Utah or U.S. for a given time period.Why Is This Important?
Cancer is the second leading cause of death in both the U.S. and in Utah. A cancer diagnosis places a significant burden on the social, emotional, financial, and mental wellbeing of patients. The financial costs of cancer are substantial both for patients and health care systems on the whole. The Agency for Healthcare Research and Quality (AHRQ) estimates that the direct medical costs (total of all health care costs) for cancer in the US in 2015 were $80.2 billion.^1^ Cancer comes in many different forms. Cancers generally develop over several years and can have many causes. Several factors both inside and outside the body may contribute to the development of cancer. Some of these factors include genetic mutations, tobacco and alcohol use, poor diet, obesity, physical inactivity, and excessive sunlight exposure. Other factors may include exposure to ionizing radiation and environmental chemicals that may be present in the workplace, food, air, or water such as asbestos, benzene, and arsenic. --- 1 Economic Impact of Cancer, American Cancer Society, https://www.cancer.org/cancer/cancer-basics/economic-impact-of-cancer.htmlHealthy People Objective C-1:
Reduce the overall cancer death rateU.S. Target: 161.4 deaths per 100,000 population
Other Objectives
Utah's 42 Community Health Indicators[[br]] CSTE Chronic Disease IndicatorsHow Are We Doing?
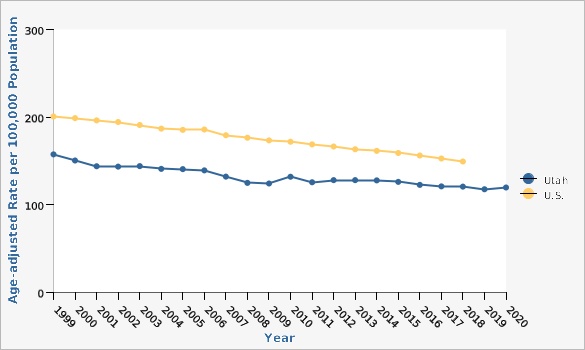
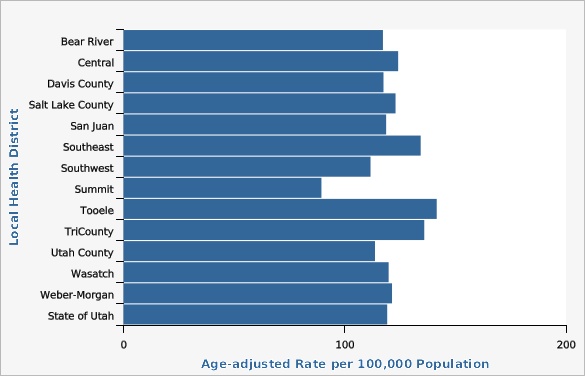
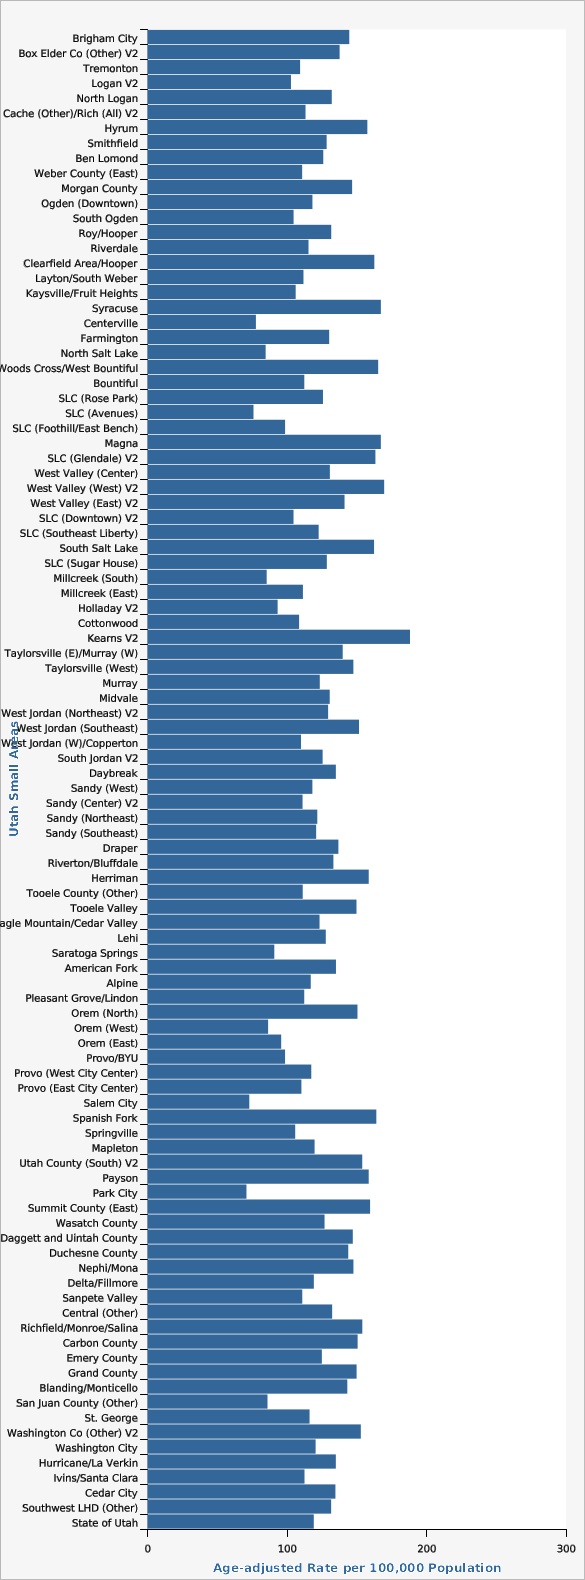
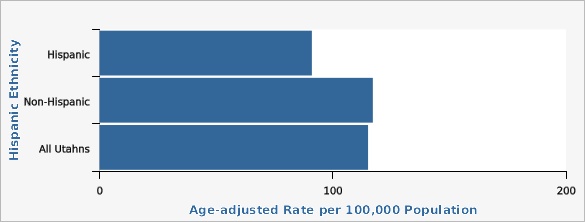
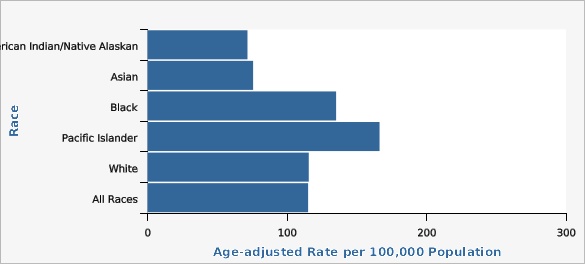
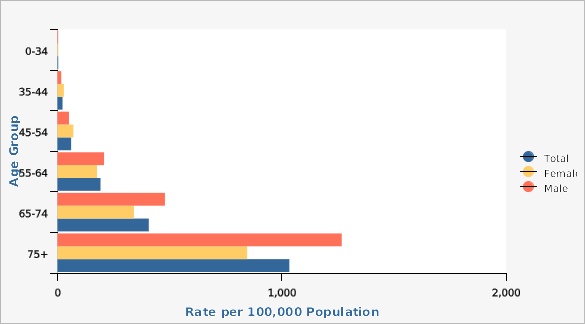
The age-adjusted cancer mortality rate in Utah has generally decreased over the last 30 years. In 2020, the age-adjusted cancer mortality rate in Utah was 119.5 deaths per 100,000 people, down from a rate of 131.9 deaths per 100,000 people in 2010. There are differences in cancer mortality rates throughout Utah based on geography, race, ethnicity, age, and sex. For years 2018-2020, the Tooele County Local Health District (LHD) had the highest cancer mortality rate (141.6 deaths per 100,000 persons) in the state compared to other LHDs, while the Summit County LHD had the lowest (89.5 deaths per 100,000 persons). Differences in cancer mortality rates can also be seen within each LHD at the Utah Small Area level (see Small Area Data View). Non-Hispanic persons had a significantly higher rate of cancer mortality (117.2 deaths per 100,000 persons) than Hispanic persons (91.1 deaths per 100,000 persons), based on age-adjusted data from 2018-2020. For that same time period, those who racially identify as Black and Pacific Islander had the highest rates of cancer mortality (135.2 deaths per 100,000 persons and 166.4 deaths per 100,000 persons, respectively) when compared to all other races, while those who identify as Asian or American Indian/Alaskan Native had a significantly lower rate of cancer mortality (75.7 deaths per 100,000 persons and 71.7 deaths per 100,000 persons, respectively; both are statistically significant) compared to all other races. The rate of cancer death significantly increases with age, regardless of sex. For ages 0-54, women are more likely to die as a result of cancer than men, though after age 55, men are more likely to die as a result of cancer than women. See additional data views for more detailed information.How Do We Compare With the U.S.?
The age-adjusted overall cancer mortality rate in Utah has been consistently lower than the U.S. rate for the last 30 years. The latest comparative data reports from 2018 indicate that the Utah cancer death rate was 120.5 deaths per 100,000 persons, significantly lower than the U.S. rate of 149.2 deaths per 100,000 persons.What Is Being Done?
The Utah Comprehensive Cancer Control program (CCC) and its affiliated coalition, the Utah Cancer Action Network (UCAN), work together with state and local partners to reduce the burden of cancer in Utah. Their mission is to lower cancer incidence, morbidity, and mortality in Utah through collaborative efforts directed toward cancer prevention and control. As a result, they support community-based strategies around food security, healthy neighborhoods, access to health care, and financial toxicity in order to prevent cancer; detect cancer early; and improve the lives of cancer survivors, caregivers, and their families.Available Services
The Utah Cancer Control Program (UCCP) provides free to low cost clinical breast exams, mammogram, pelvic exams, and Pap smears to women aged 21-64 who are uninsured/under-insured with low to moderate income. In addition, the UCCP provides education about the need for early detection and the availability of screening services, supports health systems and employers throughout Utah to increase availability of cancer screening and create policies around cancer screening, and evaluates and disseminates information about breast and cervical cancers to community stakeholders. Women in need of cancer treatment are enrolled into Medicaid as per the Breast and Cervical Cancer Treatment Act. Visit [http://www.cancerutah.org] or call 1-800-717-1811 for more information or to see if you qualify for free mammography services.Health Program Information
In 1976, the Utah Department of Health received a cervical cancer grant from the National Cancer Institute. In 1980, the Utah Department of Health began providing clinical breast exams and Pap tests on a sliding fee scale. In 1993, state funding was appropriated for mammography. That same year, the Utah Cancer Control Program (UCCP) first received a capacity building grant from the Centers for Disease Control and Prevention (CDC) to lay the groundwork for breast and cervical cancer screening in Utah. A five year comprehensive grant was awarded to the program in 1994 to continue breast and cervical cancer screening. In October 1999, this grant was renewed for an additional five years. The UCCP continues to receive funding from the CDC for breast and cervical cancer screenings. With this funding, the UCCP and partners, including local health departments, mammography facilities, pathology laboratories, and private providers, have worked together to ensure the appropriate and timely provision of clinical services. Additionally, the Utah Comprehensive Cancer Control program (CCC) receives funding to implement cancer prevention and control strategies identified by the program and the Utah Cancer Action Network (UCAN) coalition. Starting in 2014, the UCCP also received funding from the CDC to implement cancer genomics strategies focused on hereditary breast and ovarian cancer (associated with BRCA1/2 mutations) and Lynch syndrome cancers, specifically colorectal and uterine.Related Indicators
Relevant Population Characteristics
The risk of developing cancer increases with increasing age.Related Relevant Population Characteristics Indicators:
- Utah Population Characteristics: Age Distribution of the Population
- Alcohol Consumption - Heavy Drinking
- Bladder Cancer
- Cancer of the Brain and Central Nervous System
- Breast Cancer Deaths
- Breast Cancer Incidence
- Breast Cancer Screening (Mammography)
- Cervical Cancer Death
- Cervical Cancer Incidence
- Cervical Cancer Screening (Pap)
- Smoking Among Adults
- Colorectal Cancer Deaths
- Colorectal Cancer Incidence
- Colorectal Cancer Screening
- Deaths From All Causes
- Utah Health Improvement Index (HII)
- Leukemias
- Lung Cancer Incidence
- Lung Cancer Deaths
- Melanoma of the Skin Deaths
- Melanoma of the Skin Incidence
- Non-Hodgkin Lymphoma
- Obesity Among Adults
- Prostate Cancer Deaths
- Prostate Cancer Incidence
- Prostate Cancer Screening
Health Care System Factors
There are high financial costs associated with cancer care, presenting a barrier to receiving appropriate, life-prolonging treatment, especially among the uninsured and underinsured. For the majority of cancer types, early detection is key to increasing treatment options and prognosis, health outcomes, and prolonged life. Receiving appropriate cancer screenings, according to the current recommendations, are an effective strategy to detect cancer early and promote favorable health outcomes. Insurance status and factors such as education attainment and socioeconomic status are key facilitators or barriers to accessing and participating in cancer screening services as well as cancer treatment received.Related Health Care System Factors Indicators:
Risk Factors
Increasing age is a risk factor for developing cancer. More than 87% of all cancers are diagnosed in persons aged 50 years or older. Other risk factors for cancer include a person's gender and family medical history. Cancer may also be linked to environmental exposures and lifestyle choices such as use of tobacco and alcohol, diet, and sun exposure. In fact, tobacco use remains the world's most preventable cause of death. Despite decades of declines in cigarette smoking prevalence, almost one-third (32%) of cancer deaths in the U.S. and as much as 40% in men in some Southern states are still caused by smoking.^1^[[br]] [[br]] ---- 1. American Cancer Society, Cancer Facts & Figures 2018, p.44.Related Risk Factors Indicators:
Graphical Data Views
| Utah vs. U.S. | Year | Age-adjusted Rate per 100,000 Population | Lower Limit | Upper Limit | ||
|---|---|---|---|---|---|---|
Record Count: 42 | ||||||
| Utah | 1999 | 157.5 | 151.2 | 164.0 | ||
| Utah | 2000 | 150.3 | 144.3 | 156.6 | ||
| Utah | 2001 | 143.8 | 137.9 | 149.8 | ||
| Utah | 2002 | 143.4 | 137.6 | 149.3 | ||
| Utah | 2003 | 144.0 | 138.3 | 149.9 | ||
| Utah | 2004 | 140.9 | 135.3 | 146.6 | ||
| Utah | 2005 | 140.5 | 135.0 | 146.1 | ||
| Utah | 2006 | 139.1 | 133.8 | 144.6 | ||
| Utah | 2007 | 132.0 | 126.9 | 137.3 | ||
| Utah | 2008 | 124.8 | 119.9 | 129.8 | ||
| Utah | 2009 | 124.2 | 119.3 | 129.1 | ||
| Utah | 2010 | 131.9 | 127.0 | 136.9 | ||
| Utah | 2011 | 125.5 | 120.8 | 130.4 | ||
| Utah | 2012 | 127.9 | 123.2 | 132.8 | ||
| Utah | 2013 | 127.9 | 123.3 | 132.7 | ||
| Utah | 2014 | 127.6 | 123.1 | 132.3 | ||
| Utah | 2015 | 126.0 | 121.5 | 130.6 | ||
| Utah | 2016 | 122.6 | 118.2 | 127.0 | ||
| Utah | 2017 | 120.9 | 116.7 | 125.2 | ||
| Utah | 2018 | 120.5 | 116.4 | 124.8 | ||
| Utah | 2019 | 117.6 | 113.6 | 121.8 | ||
| Utah | 2020 | 119.5 | 115.5 | 123.6 | ||
| U.S. | 1999 | 200.7 | 200.2 | 201.2 | ||
| U.S. | 2000 | 198.8 | 198.3 | 199.3 | ||
| U.S. | 2001 | 196.3 | 195.8 | 196.8 | ||
| U.S. | 2002 | 194.4 | 193.8 | 194.9 | ||
| U.S. | 2003 | 190.9 | 190.4 | 191.4 | ||
| U.S. | 2004 | 186.8 | 186.4 | 187.3 | ||
| U.S. | 2005 | 185.3 | 184.8 | 185.8 | ||
| U.S. | 2006 | 185.8 | 181.6 | 182.5 | ||
| U.S. | 2007 | 179.3 | 178.8 | 179.7 | ||
| U.S. | 2008 | 176.3 | 175.8 | 176.8 | ||
| U.S. | 2009 | 173.4 | 172.9 | 173.8 | ||
| U.S. | 2010 | 171.8 | 171.3 | 172.2 | ||
| U.S. | 2011 | 168.8 | 168.4 | 169.2 | ||
| U.S. | 2012 | 166.4 | 166.0 | 166.8 | ||
| U.S. | 2013 | 163.3 | 162.9 | 163.7 | ||
| U.S. | 2014 | 161.4 | 161.0 | 161.9 | ||
| U.S. | 2015 | 159.0 | 158.6 | 159.4 | ||
| U.S. | 2016 | 156.1 | 155.7 | 156.5 | ||
| U.S. | 2017 | 152.7 | 152.3 | 153.1 | ||
| U.S. | 2018 | 149.2 | 148.8 | 149.6 | ||
Data Notes
ICD-10 codes C00-C97. Age-adjusted to the U.S. 2000 standard population.Data Sources
- Utah Death Certificate Database, Office of Vital Records and Statistics, Utah Department of Health
- Population Estimates: National Center for Health Statistics (NCHS) through a collaborative agreement with the U.S. Census Bureau, IBIS Version 2020
- U.S. Cancer Statistics: WONDER Online Database. United States Department of Health and Human Services, Centers for Disease Control and Prevention and National Cancer Institute. Accessed at [http://wonder.cdc.gov/cancer.html]
| Local Health District | Age-adjusted Rate per 100,000 Population | Lower Limit | Upper Limit | |||
|---|---|---|---|---|---|---|
Record Count: 14 | ||||||
| Bear River | 117.3 | 107.6 | 127.6 | |||
| Central | 124.1 | 111.2 | 138.1 | |||
| Davis County | 117.5 | 110.3 | 125.1 | |||
| Salt Lake County | 123.0 | 119.0 | 127.0 | |||
| San Juan | 118.7 | 90.2 | 153.3 | |||
| Southeast | 134.3 | 116.5 | 154.1 | |||
| Southwest | 111.6 | 105.1 | 118.5 | |||
| Summit | 89.5 | 72.4 | 109.3 | |||
| Tooele | 141.6 | 123.2 | 161.9 | |||
| TriCounty | 135.9 | 118.0 | 155.8 | |||
| Utah County | 113.7 | 107.6 | 120.0 | |||
| Wasatch | 119.8 | 96.7 | 146.8 | |||
| Weber-Morgan | 121.4 | 113.5 | 129.6 | |||
| State of Utah | 119.2 | 116.8 | 121.6 | |||
Data Notes
ICD-10 codes C00-C97. Age-adjusted to the U.S. 2000 standard population.Data Sources
- Utah Death Certificate Database, Office of Vital Records and Statistics, Utah Department of Health
- Population Estimates: National Center for Health Statistics (NCHS) through a collaborative agreement with the U.S. Census Bureau, IBIS Version 2020
| Utah Small Areas | Age-adjusted Rate per 100,000 Population | Lower Limit | Upper Limit | |||
|---|---|---|---|---|---|---|
Record Count: 100 | ||||||
| Brigham City | 144.6 | 119.4 | 173.7 | |||
| Box Elder Co (Other) V2 | 137.7 | 101.4 | 182.8 | |||
| Tremonton | 109.4 | 81.4 | 144.0 | |||
| Logan V2 | 102.8 | 85.3 | 122.9 | |||
| North Logan | 132.1 | 101.2 | 169.5 | |||
| Cache (Other)/Rich (All) V2 | 113.3 | 88.9 | 142.3 | |||
| Hyrum | 157.6 | 99.4 | 237.4 | |||
| Smithfield | 128.4 | 91.1 | 176.0 | |||
| Ben Lomond | 126.0 | 109.4 | 144.4 | |||
| Weber County (East) | 110.9 | 92.4 | 131.9 | |||
| Morgan County | 146.7 | 106.5 | 197.1 | |||
| Ogden (Downtown) | 118.2 | 96.9 | 142.8 | |||
| South Ogden | 104.7 | 87.3 | 124.5 | |||
| Roy/Hooper | 131.7 | 112.0 | 153.8 | |||
| Riverdale | 115.4 | 94.1 | 140.2 | |||
| Clearfield Area/Hooper | 162.6 | 140.2 | 187.5 | |||
| Layton/South Weber | 111.8 | 96.9 | 128.4 | |||
| Kaysville/Fruit Heights | 106.2 | 86.0 | 129.7 | |||
| Syracuse | 167.3 | 129.1 | 213.2 | |||
| Centerville | 77.7 | 56.5 | 104.2 | |||
| Farmington | 130.2 | 99.8 | 167.0 | |||
| North Salt Lake | 84.7 | 58.5 | 118.5 | |||
| Woods Cross/West Bountiful | 165.4 | 118.6 | 224.5 | |||
| Bountiful | 112.4 | 97.3 | 129.2 | |||
| SLC (Rose Park) | 125.8 | 101.7 | 153.8 | |||
| SLC (Avenues) | 76.0 | 58.9 | 96.5 | |||
| SLC (Foothill/East Bench) | 98.6 | 77.7 | 123.5 | |||
| Magna | 167.3 | 133.2 | 207.4 | |||
| SLC (Glendale) V2 | 163.4 | 128.9 | 204.2 | |||
| West Valley (Center) | 130.7 | 110.2 | 154.0 | |||
| West Valley (West) V2 | 169.7 | 131.2 | 215.9 | |||
| West Valley (East) V2 | 141.2 | 119.9 | 165.4 | |||
| SLC (Downtown) V2 | 104.7 | 85.4 | 127.1 | |||
| SLC (Southeast Liberty) | 122.7 | 95.4 | 155.4 | |||
| South Salt Lake | 162.4 | 133.6 | 195.6 | |||
| SLC (Sugar House) | 128.6 | 108.3 | 151.6 | |||
| Millcreek (South) | 85.4 | 68.3 | 105.6 | |||
| Millcreek (East) | 111.4 | 90.4 | 135.9 | |||
| Holladay V2 | 93.3 | 76.3 | 113.0 | |||
| Cottonwood | 108.7 | 94.0 | 125.0 | |||
| Kearns V2 | 188.2 | 155.2 | 226.0 | |||
| Taylorsville (E)/Murray (W) | 139.9 | 118.0 | 164.8 | |||
| Taylorsville (West) | 147.6 | 124.1 | 174.2 | |||
| Murray | 123.5 | 103.9 | 145.7 | |||
| Midvale | 130.6 | 107.5 | 157.2 | |||
| West Jordan (Northeast) V2 | 129.5 | 103.7 | 159.7 | |||
| West Jordan (Southeast) | 151.6 | 124.0 | 183.5 | |||
| West Jordan (W)/Copperton | 110.0 | 79.1 | 149.0 | |||
| South Jordan V2 | 125.5 | 105.2 | 148.7 | |||
| Daybreak | 135.0 | 98.1 | 181.2 | |||
| Sandy (West) | 118.2 | 96.5 | 143.3 | |||
| Sandy (Center) V2 | 111.2 | 88.7 | 137.5 | |||
| Sandy (Northeast) | 121.7 | 98.2 | 149.2 | |||
| Sandy (Southeast) | 120.9 | 98.3 | 147.2 | |||
| Draper | 136.8 | 110.9 | 167.1 | |||
| Riverton/Bluffdale | 133.3 | 108.9 | 161.5 | |||
| Herriman | 158.6 | 122.0 | 202.6 | |||
| Tooele County (Other) | 111.3 | 80.4 | 150.0 | |||
| Tooele Valley | 149.8 | 128.0 | 174.2 | |||
| Eagle Mountain/Cedar Valley | 123.3 | 83.4 | 175.7 | |||
| Lehi | 127.8 | 105.6 | 153.4 | |||
| Saratoga Springs | 90.9 | 58.2 | 135.2 | |||
| American Fork | 135.1 | 113.1 | 160.1 | |||
| Alpine | 117.0 | 79.0 | 166.9 | |||
| Pleasant Grove/Lindon | 112.4 | 93.4 | 134.1 | |||
| Orem (North) | 150.5 | 124.2 | 180.8 | |||
| Orem (West) | 86.5 | 67.2 | 109.5 | |||
| Orem (East) | 95.8 | 74.3 | 121.7 | |||
| Provo/BYU | 98.6 | 80.3 | 119.9 | |||
| Provo (West City Center) | 117.4 | 89.6 | 151.2 | |||
| Provo (East City Center) | 110.3 | 74.9 | 156.7 | |||
| Salem City | 73.0 | 42.9 | 116.1 | |||
| Spanish Fork | 164.0 | 135.8 | 196.4 | |||
| Springville | 105.9 | 83.2 | 132.8 | |||
| Mapleton | 119.8 | 78.9 | 174.4 | |||
| Utah County (South) V2 | 153.9 | 106.2 | 215.8 | |||
| Payson | 158.6 | 126.5 | 196.2 | |||
| Park City | 70.9 | 50.5 | 96.9 | |||
| Summit County (East) | 159.6 | 117.0 | 212.6 | |||
| Wasatch County | 126.9 | 102.8 | 155.0 | |||
| Daggett and Uintah County | 147.2 | 122.8 | 174.9 | |||
| Duchesne County | 143.9 | 113.6 | 179.8 | |||
| Nephi/Mona | 147.6 | 103.0 | 205.0 | |||
| Delta/Fillmore | 119.2 | 85.7 | 161.5 | |||
| Sanpete Valley | 111.0 | 85.8 | 141.2 | |||
| Central (Other) | 132.4 | 109.2 | 159.0 | |||
| Richfield/Monroe/Salina | 154.0 | 121.8 | 192.1 | |||
| Carbon County | 150.6 | 123.2 | 182.4 | |||
| Emery County | 125.0 | 89.2 | 170.3 | |||
| Grand County | 149.9 | 113.3 | 194.5 | |||
| Blanding/Monticello | 143.2 | 99.2 | 200.1 | |||
| San Juan County (Other) | 86.0 | 47.3 | 143.7 | |||
| St. George | 116.2 | 105.4 | 127.7 | |||
| Washington Co (Other) V2 | 152.9 | 119.4 | 192.9 | |||
| Washington City | 120.5 | 97.9 | 146.8 | |||
| Hurricane/La Verkin | 135.0 | 111.6 | 161.9 | |||
| Ivins/Santa Clara | 112.6 | 88.5 | 141.1 | |||
| Cedar City | 134.7 | 113.9 | 158.2 | |||
| Southwest LHD (Other) | 131.6 | 109.7 | 156.8 | |||
| State of Utah | 119.2 | 116.8 | 121.6 | |||
Data Notes
ICD-10 codes C00-C97. Age-adjusted to the U.S. 2000 standard population. A description of the Utah Small Areas may be found on IBIS at the following URL: [https://ibis.health.utah.gov/resource/Guidelines.html].Data Source
Utah Death Certificate Database, Office of Vital Records and Statistics, Utah Department of Health| Hispanic Ethnicity | Age-adjusted Rate per 100,000 Population | Lower Limit | Upper Limit | |||
|---|---|---|---|---|---|---|
Record Count: 3 | ||||||
| Hispanic | 91.0 | 83.5 | 99.1 | |||
| Non-Hispanic | 117.2 | 114.8 | 119.6 | |||
| All Utahns | 115.1 | 112.9 | 117.4 | |||
Data Notes
ICD-10 codes C00-C97. Rates are age-adjusted to the 2000 U.S. standard population using 3 age groups, 0-44, 45-64, and 65+.Data Sources
- Utah Death Certificate Database, Office of Vital Records and Statistics, Utah Department of Health
- Population Estimates by Age, Sex, Race, and Hispanic Origin for Counties in Utah, U.S. Bureau of the Census, IBIS Version 2020
| Race | Age-adjusted Rate per 100,000 Population | Lower Limit | Upper Limit | |||
|---|---|---|---|---|---|---|
Record Count: 6 | ||||||
| American Indian/Native Alaskan | 71.7 | 54.7 | 92.2 | |||
| Asian | 75.7 | 63.7 | 89.3 | |||
| Black | 135.2 | 107.0 | 168.6 | |||
| Pacific Islander | 166.4 | 134.9 | 202.9 | |||
| White | 115.6 | 113.3 | 118.0 | |||
| All Races | 115.1 | 112.9 | 117.4 | |||
Data Notes
ICD-10 codes C00-C97. Age-adjusted to the U.S. 2000 standard population using 3 age groups, 0-44, 45-64, and 65+.Data Sources
- Utah Death Certificate Database, Office of Vital Records and Statistics, Utah Department of Health
- Population Estimates by Age, Sex, Race, and Hispanic Origin for Counties in Utah, U.S. Bureau of the Census, IBIS Version 2020
| Males vs. Females | Age Group | Rate per 100,000 Population | Lower Limit | Upper Limit | ||
|---|---|---|---|---|---|---|
Record Count: 18 | ||||||
| Male | 0-34 | 3.1 | 2.4 | 3.8 | ||
| Male | 35-44 | 16.7 | 13.8 | 20.1 | ||
| Male | 45-54 | 51.2 | 45.1 | 57.8 | ||
| Male | 55-64 | 207.5 | 194.4 | 221.3 | ||
| Male | 65-74 | 479.0 | 455.2 | 503.8 | ||
| Male | 75+ | 1,267.5 | 1,218.0 | 1,318.5 | ||
| Female | 0-34 | 3.5 | 2.8 | 4.3 | ||
| Female | 35-44 | 28.5 | 24.5 | 32.9 | ||
| Female | 45-54 | 70.7 | 63.4 | 78.5 | ||
| Female | 55-64 | 176.5 | 164.6 | 189.0 | ||
| Female | 65-74 | 340.8 | 321.5 | 360.9 | ||
| Female | 75+ | 845.7 | 809.5 | 883.2 | ||
| Total | 0-34 | 3.3 | 2.8 | 3.8 | ||
| Total | 35-44 | 22.5 | 20.0 | 25.2 | ||
| Total | 45-54 | 60.8 | 56.0 | 65.8 | ||
| Total | 55-64 | 191.7 | 182.8 | 201.0 | ||
| Total | 65-74 | 407.1 | 391.8 | 422.8 | ||
| Total | 75+ | 1,033.8 | 1,003.9 | 1,064.4 | ||
Data Notes
ICD-10 codes C00-C97.Data Sources
- Utah Death Certificate Database, Office of Vital Records and Statistics, Utah Department of Health
- Population Estimates: National Center for Health Statistics (NCHS) through a collaborative agreement with the U.S. Census Bureau, IBIS Version 2020
References and Community Resources
Utah Cancer Control Program: [http://www.cancerutah.org][[br]] Utah Cancer Action Network: [http://www.ucan.cc][[br]] Susan G. Komen Foundation: [http://www.komen.org][[br]] American Cancer Society: [http://www.cancer.org][[br]] National Cancer Institute: [http://www.cancer.gov][[br]] Huntsman Cancer Institute: [http://www.huntsmancancer.org][[br]] Centers for Disease Control and Prevention: [http://www.cdc.gov][[br]] American Society of Clinical Oncology: [http://www.asco.org]More Resources and Links
Evidence-based community health improvement ideas and interventions may be found at the following sites:- Centers for Disease Control and Prevention (CDC) WONDER Database, a system for disseminating public health data and information.
- United States Census Bureau data dashboard.
- Utah healthy Places Index, evidence-based and peer-reviewed tool, supports efforts to prioritize equitable community investments, develop critical programs and policies across the state, and much more.
- County Health Rankings
- Kaiser Family Foundation's StateHealthFacts.org
- Medical literature can be queried at PubMed library.
Page Content Updated On 04/14/2022,
Published on 11/10/2022

