
Complete Health Indicator Report of Retail Food Safety
Definition
This report provides information pertinent to the safety of food products prepared by retail food establishments in Utah. Included are the ratio of food establishments to restaurant inspectors, number of permitted restaurant facilities, number of food handlers trained, number of food safety enforcements, and number of restaurant inspections.Numerator
This Indicator Report contains the following variables:[[br]] 1) Number of licensed food establishments[[br]] 2) Number of permitted facilities by designation[[br]] 3) Number of food handlers trained[[br]] 4) Number of food safety enforcement actions[[br]] 5) Number of inspections by typeDenominator
1) Number of restaurant operators[[br]] 2) Not applicable[[br]] 3) Not applicable[[br]] 4) Not applicable[[br]] 5) Not applicableWhy Is This Important?
Foodborne disease outbreaks sometimes result from failures in protective systems but are more often the result of improper food handling. Children, the very old, and people with weakened immune systems are at increased risk of infection and death resulting from food contamination. The U.S. Centers for Disease Control and Prevention (CDC) estimates that 1 in 6 Americans get sick from contaminated foods or beverages and 3,000 die each year. The U.S. Department of Agriculture (USDA) estimates that foodborne illnesses cost $15.6 billion each year.Other Objectives
Safe restaurant food is addressed in the following Healthy People Objective[[br]] ===Healthy People Objective FS-6:=== Increase the proportion of fast-food and full-service restaurants that follow food safety practices that prevent foodborne illness outbreaks * '''FS-6.1:''' Increase the proportion of fast-food restaurants where employees practice proper handwashing * '''FS-6.2:''' Increase the proportion of fast-food restaurants where food employees do not contact ready-to-eat (RTE) foods with bare hands * '''FS-6.3:''' Increase the proportion of fast-food restaurants where food contact surfaces are properly cleaned and sanitized * '''FS-6.4:''' Increase the proportion of fast-food restaurants where foods requiring refrigeration are held at the proper temperature * '''FS-6.5:''' Increase the proportion of fast-food restaurants where foods displayed or stored hot are held at the proper temperature * '''FS-6.6:''' Increase the proportion of full-service restaurants where employees practice proper handwashing * '''FS-6.7:''' Increase the proportion of full-service restaurants where food employees do not contact RTE foods with bare hands * '''FS-6.8:''' Increase the proportion of full-service restaurants where food contact surfaces are properly cleaned and sanitized * '''FS-6.9:''' Increase the proportion of full-service restaurants where foods requiring refrigeration are held at the proper temperature * '''FS-6.10:''' Increase the proportion of full-service restaurants where foods displayed or stored hot are held at the proper temperatureHow Are We Doing?
The food protection programs of Utah are encouraged to enroll and participate in the [https://www.fda.gov/Food/GuidanceRegulation/RetailFoodProtection/ProgramStandards/ucm245409.htm Voluntary National Retail Food Regulatory Program Standards (Retail Program Standards)]. These standards promote consistent food protection practices in retail food establishments and encompass areas such as regulations, training, and public education. As of November 2023, two state agencies, the Utah Department of Health and Human Services and the Utah Department of Agriculture and Food, and the following local health departments are enrolled in the Retail Program Standards:[[br]] *Bear River Health Department *Central Utah Public Health Department *Davis County Health Department *Salt Lake County Health Department *Southeastern Utah District Health Department *Southwest Utah Public Health Department *Summit County Health Department *Tooele County Health Department *Utah County Health Department *Weber-Morgan Health Department [[br]] All the enrolled jurisdictions meet Standard 1 for using regulations consistent with the FDA Model Food Code. The Utah Department of Health and Human Services has one FTE available to provide training, standardization, data collection, and other support for the statewide food protection program.Available Services
Contact the local health departments for information regarding retail food establishments and restaurant inspection results.Related Indicators
Related Relevant Population Characteristics Indicators:
Related Health Status Outcomes Indicators:
Graphical Data Views
Ratio of Licensed Food Establishments to Restaurant Inspectors, Utah, FY 1999 - FY 2023

The number of licensed permanent food establishments increased 0.6% from 13,243 in FY 2022 to 13,323 in FY 2023. The number of temporary food establishments decreased 9.05% from 3,305 in FY 2022 to 3,006 in FY 2023.
| Permanent vs. Total | Fiscal Year | Ratio of Licensed Food Est. to Restaurant Inspectors | ||||
|---|---|---|---|---|---|---|
Record Count: 26 | ||||||
| Total Est. (Perm & Temp) | 1999 | 291 | ||||
| Total Est. (Perm & Temp) | 2000 | 294 | ||||
| Total Est. (Perm & Temp) | 2001 | 229 | ||||
| Total Est. (Perm & Temp) | 2002 | 220 | ||||
| Total Est. (Perm & Temp) | 2003 | 185 | ||||
| Total Est. (Perm & Temp) | 2004 | 293 | ||||
| Total Est. (Perm & Temp) | 2005 | 275 | ||||
| Total Est. (Perm & Temp) | 2006 | 281 | ||||
| Total Est. (Perm & Temp) | 2007 | 231 | ||||
| Total Est. (Perm & Temp) | 2008 | 303 | ||||
| Total Est. (Perm & Temp) | 2009 | 307 | ||||
| Total Est. (Perm & Temp) | 2010 | 348 | ||||
| Total Est. (Perm & Temp) | 2011 | 330 | ||||
| Total Est. (Perm & Temp) | 2012 | 373 | ||||
| Total Est. (Perm & Temp) | 2013 | 376 | ||||
| Total Est. (Perm & Temp) | 2014 | 383 | ||||
| Total Est. (Perm & Temp) | 2015 | 386 | ||||
| Total Est. (Perm & Temp) | 2016 | 390 | ||||
| Total Est. (Perm & Temp) | 2017 | 283 | ||||
| Total Est. (Perm & Temp) | 2018 | 285 | ||||
| Total Est. (Perm & Temp) | 2019 | 319 | ||||
| Total Est. (Perm & Temp) | 2020 | 258 | ||||
| Total Est. (Perm & Temp) | 2021 | 209 | ||||
| Total Est. (Perm & Temp) | 2022 | 217 | ||||
| Total Est. (Perm & Temp) | 2023 | 234 | ||||
Data Notes
The FDA's recommended ratio is 1:280-320. Ratio numerator: Number of licensed food establishments[[br]] Ratio denominator: Number of restaurant inspectors The U.S. Food and Drug Administration recommends a minimum staffing ratio of one restaurant inspector (full-time equivalent, or FTE) for every 280-320 food establishments. This recommendation comes from the [http://www.fda.gov/Food/GuidanceRegulation/RetailFoodProtection/ProgramStandards/ucm245409.htm FDA's Retail Food Regulatory Program Standards] as part of Standard 8. There are two main types of inspections which need to be conducted: those for permanent restaurants and those for temporary establishments. Temporary establishments include those food booths regularly seen at fairs, shows, or other events. Permanent restaurants would include brick and mortar establishments as well as any mobile vendors, including food truck or carts, doing business on a consistent basis.Data Source
Utah Department of Health and Human Services Food Safety ProgramRatio of Licensed Food Establishments to Restaurant Inspectors by Local Health District, Utah, FY 2023

The U.S. Food and Drug Administration recommends a minimum staffing ratio of one restaurant inspector (full-time equivalent, or FTE) for every 280-320 food establishments. This recommendation comes from the [http://www.fda.gov/Food/GuidanceRegulation/RetailFoodProtection/ProgramStandards/ucm245409.htm FDA's Retail Food Regulatory Program Standards] as part of Standard 8.
When looking strictly at permanent establishments, all 13 local health departments met this standard in FY 2023. However, when including temporary establishments, eight local health departments met this standard in FY 2023.
Statewide in FY 2023, the local health departments had 69.75 FTEs committed to inspecting 13,323 permanent food service establishments and 3,006 temporary food establishments. Statewide no additional FTEs are needed to meet this standard.
| Permanent vs. Total | Local Health District | Ratio of Licensed Food Est. to Restaurant Inspectors | Numer- ator | Denom- inator | ||
|---|---|---|---|---|---|---|
Record Count: 28 | ||||||
| Permanent Est. Only | Bear River | 205 | 717 | 3.5 | ||
| Permanent Est. Only | Central | 125 | 500 | 4 | ||
| Permanent Est. Only | Davis County | 261 | 1,043 | 4 | ||
| Permanent Est. Only | Salt Lake County | 277 | 4,977 | 18 | ||
| Permanent Est. Only | San Juan | 36 | 45 | 1.25 | ||
| Permanent Est. Only | Southeast | 69 | 346 | 5 | ||
| Permanent Est. Only | Southwest | 113 | 1,241 | 11 | ||
| Permanent Est. Only | Summit | 202 | 404 | 2 | ||
| Permanent Est. Only | Tooele | 183 | 275 | 1.5 | ||
| Permanent Est. Only | TriCounty | 289 | 289 | 1 | ||
| Permanent Est. Only | Utah County | 317 | 2,381 | 7.5 | ||
| Permanent Est. Only | Wasatch | 199 | 199 | 1 | ||
| Permanent Est. Only | Weber-Morgan | 91 | 906 | 10 | ||
| Permanent Est. Only | State of Utah | 191 | 13,323 | 69.75 | ||
| Total Est. (Perm & Temp) | Bear River | 291 | 1,020 | 3.5 | ||
| Total Est. (Perm & Temp) | Central | 132 | 529 | 4 | ||
| Total Est. (Perm & Temp) | Davis County | 303 | 1,210 | 4 | ||
| Total Est. (Perm & Temp) | Salt Lake County | 338 | 6,082 | 18 | ||
| Total Est. (Perm & Temp) | San Juan | 38 | 47 | 1.25 | ||
| Total Est. (Perm & Temp) | Southeast | 79 | 396 | 5 | ||
| Total Est. (Perm & Temp) | Southwest | 128 | 1,409 | 11 | ||
| Total Est. (Perm & Temp) | Summit | 218 | 436 | 2 | ||
| Total Est. (Perm & Temp) | Tooele | 269 | 404 | 1.5 | ||
| Total Est. (Perm & Temp) | TriCounty | 387 | 387 | 1 | ||
| Total Est. (Perm & Temp) | Utah County | 410 | 3,077 | 7.5 | ||
| Total Est. (Perm & Temp) | Wasatch | 337 | 337 | 1 | ||
| Total Est. (Perm & Temp) | Weber-Morgan | 100 | 995 | 10 | ||
| Total Est. (Perm & Temp) | State of Utah | 234 | 16,329 | 69.75 | ||
Data Notes
The FDA's recommended ratio is 1:280-320. Ratio numerator: Number of licensed food establishments Ratio denominator: Number of restaurant inspectors There are two main types of inspections which need to be conducted: those for permanent restaurants and those for temporary establishments. Temporary establishments include those food booths regularly seen at fairs, shows or other events. Permanent restaurants would include brick and mortar establishments as well as any mobile vendors, including food trucks or carts, doing business on a consistent basis.Data Source
Utah Department of Health and Human Services Food Safety ProgramNumber of Permitted Facilities (Permanent vs. Temporary), Utah, FY 2012 - FY 2023
, Utah, FY 2012 - FY 2023")
| Permanent vs. Temporary | Fiscal Year | Number of Facilities | ||||
|---|---|---|---|---|---|---|
Record Count: 24 | ||||||
| Permanent | 2012 | 10,371 | ||||
| Permanent | 2013 | 10,498 | ||||
| Permanent | 2014 | 10,608 | ||||
| Permanent | 2015 | 11,178 | ||||
| Permanent | 2016 | 11,622 | ||||
| Permanent | 2017 | 11,720 | ||||
| Permanent | 2018 | 12,153 | ||||
| Permanent | 2019 | 13,025 | ||||
| Permanent | 2020 | 12,711 | ||||
| Permanent | 2021 | 13,382 | ||||
| Permanent | 2022 | 13,243 | ||||
| Permanent | 2023 | 13,323 | ||||
| Temporary | 2012 | 4,637 | ||||
| Temporary | 2013 | 4,940 | ||||
| Temporary | 2014 | 4,795 | ||||
| Temporary | 2015 | 5,069 | ||||
| Temporary | 2016 | 5,871 | ||||
| Temporary | 2017 | 5,484 | ||||
| Temporary | 2018 | 5,254 | ||||
| Temporary | 2019 | 5,005 | ||||
| Temporary | 2020 | 2,873 | ||||
| Temporary | 2021 | 1,684 | ||||
| Temporary | 2022 | 3,305 | ||||
| Temporary | 2023 | 3,006 | ||||
Data Notes
Permanent restaurants would include brick and mortar establishments as well as any mobile vendors, including food trucks, or carts, doing business on a consistent basis. Temporary establishments include those food booths regularly seen at fairs, shows or other events.Data Source
Utah Department of Health and Human Services Food Safety ProgramNumber of Food Handlers Permitted, Utah, FY 2013 - FY 2023

Food handler training is needed to keep consistent the standard of service expected from retail food establishments. It is taken for granted how easily food may make someone sick when proper food handling procedures are not followed. Training in Utah is standard statewide, and all food handlers are required to retake an approved course every 3 years.
| Fiscal Year | Number of Food Handlers | |||||
|---|---|---|---|---|---|---|
Record Count: 11 | ||||||
| 2013 | 67,782 | |||||
| 2014 | 76,237 | |||||
| 2015 | 89,296 | |||||
| 2016 | 77,465 | |||||
| 2017 | 84,524 | |||||
| 2018 | 78,935 | |||||
| 2019 | 98,290 | |||||
| 2020 | 92,676 | |||||
| 2021 | 87,179 | |||||
| 2022 | 99,916 | |||||
| 2023 | 108,789 | |||||
Data Source
Utah Department of Health and Human Services Food Safety ProgramNumber of Food Safety Enforcement Actions, Utah, FY 2013 - FY 2023

| Fiscal Year | Number of Enforcement Actions | |||||
|---|---|---|---|---|---|---|
Record Count: 11 | ||||||
| 2013 | 669 | |||||
| 2014 | 502 | |||||
| 2015 | 525 | |||||
| 2016 | 463 | |||||
| 2017 | 396 | |||||
| 2018 | 231 | |||||
| 2019 | 295 | |||||
| 2020 | 140 | |||||
| 2021 | 83 | |||||
| 2022 | 101 | |||||
| 2023 | 293 | |||||
Data Source
Utah Department of Health and Human Services Food Safety Program| Trained vs. Enforcements | Fiscal Year | Count | ||||
|---|---|---|---|---|---|---|
Record Count: 22 | ||||||
| Food Handlers Trained | 2013 | 67,782 | ||||
| Food Handlers Trained | 2014 | 76,237 | ||||
| Food Handlers Trained | 2015 | 89,296 | ||||
| Food Handlers Trained | 2016 | 77,465 | ||||
| Food Handlers Trained | 2017 | 84,524 | ||||
| Food Handlers Trained | 2018 | 78,935 | ||||
| Food Handlers Trained | 2019 | 98,290 | ||||
| Food Handlers Trained | 2020 | 92,676 | ||||
| Food Handlers Trained | 2021 | 87,179 | ||||
| Food Handlers Trained | 2022 | 99,916 | ||||
| Food Handlers Trained | 2023 | 108,789 | ||||
| Food Safety Enforcement Actions | 2013 | 669 | ||||
| Food Safety Enforcement Actions | 2014 | 502 | ||||
| Food Safety Enforcement Actions | 2015 | 525 | ||||
| Food Safety Enforcement Actions | 2016 | 463 | ||||
| Food Safety Enforcement Actions | 2017 | 396 | ||||
| Food Safety Enforcement Actions | 2018 | 231 | ||||
| Food Safety Enforcement Actions | 2019 | 295 | ||||
| Food Safety Enforcement Actions | 2020 | 140 | ||||
| Food Safety Enforcement Actions | 2021 | 83 | ||||
| Food Safety Enforcement Actions | 2022 | 101 | ||||
| Food Safety Enforcement Actions | 2023 | 293 | ||||
Food Safety Enforcements & Trained Food Handlers
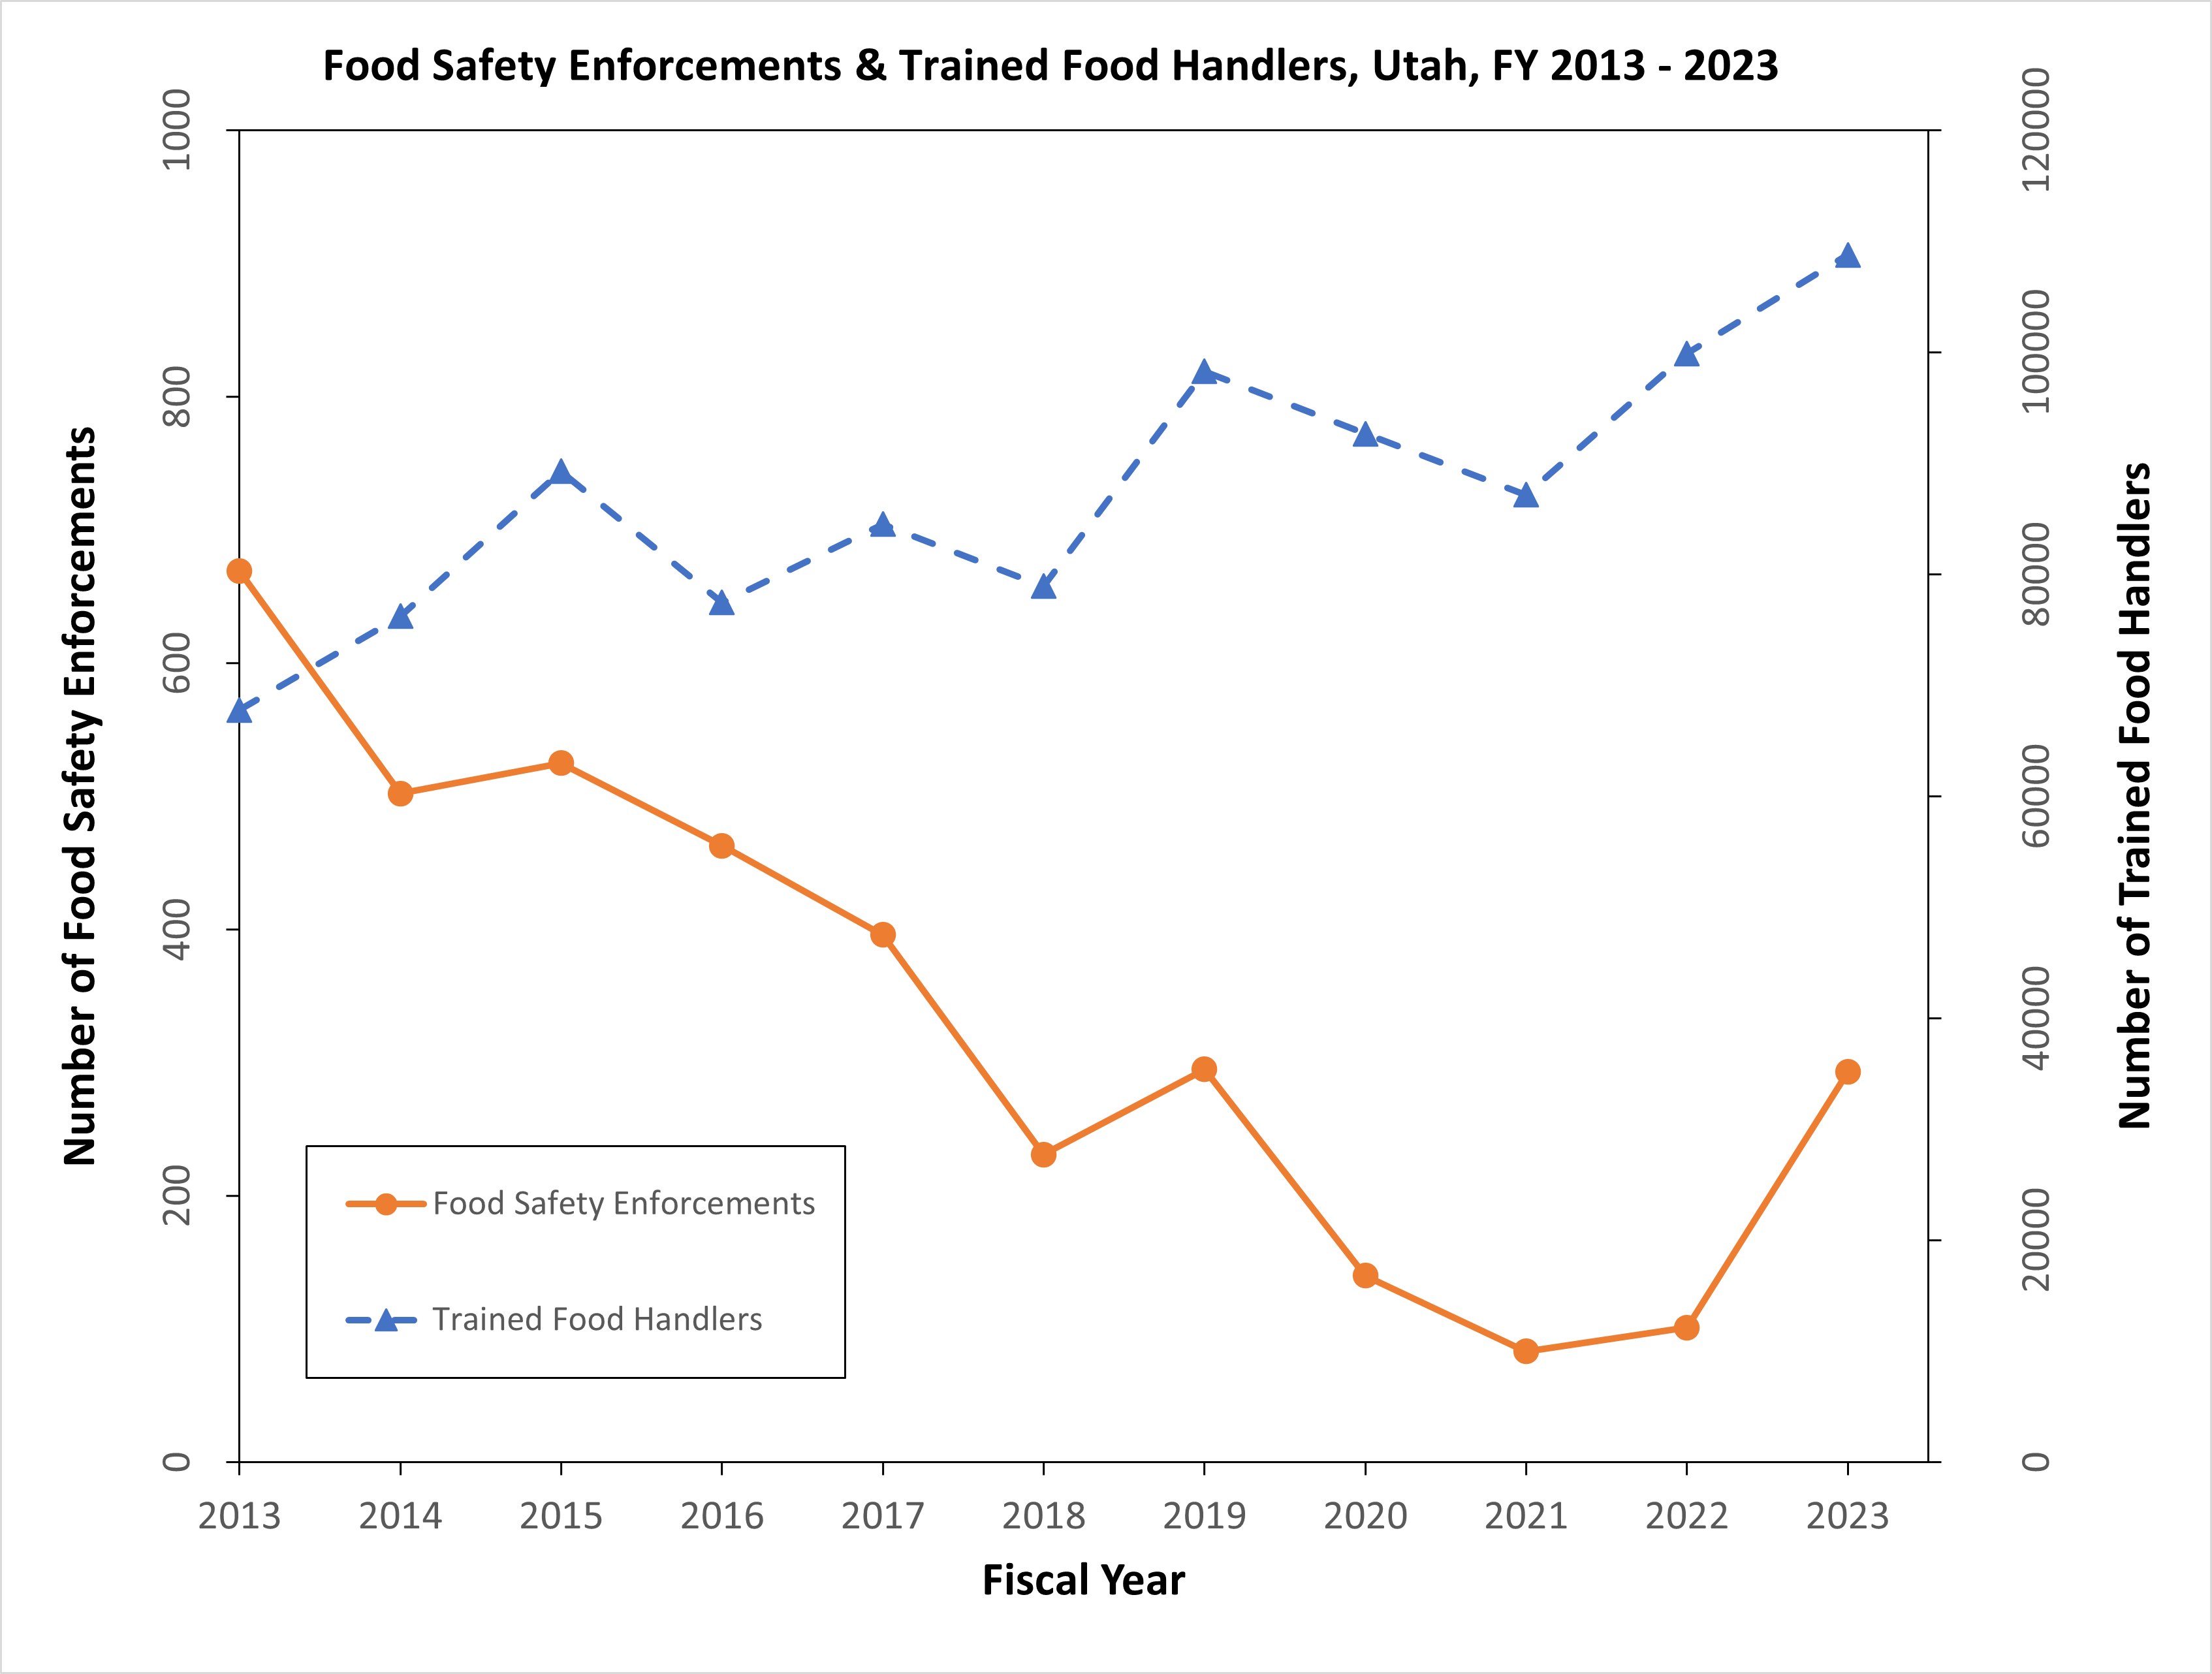
This graph above provides a co-display of the number of individuals that received food handler training (statewide) and the number of food enforcement actions (statewide) during the same fiscal year.
Food handler training is needed to keep consistent the standard of service expected from retail food establishments. It is taken for granted how easily food may make someone sick when proper food handling procedures are not followed. Training in Utah is standard statewide, and all food handlers are required to retake an approved course every 3 years.
Right click the image and open in a new tab for easier viewing.
Data Source
Utah Department of Health and Human Services Food Safety ProgramNumber of Inspections by Type, Utah, FY 2012 - FY 2023

| Inspection Type | Fiscal Year | Number of Inspections | ||||
|---|---|---|---|---|---|---|
Record Count: 36 | ||||||
| Routine | 2012 | 15,556 | ||||
| Routine | 2013 | 15,012 | ||||
| Routine | 2014 | 14,864 | ||||
| Routine | 2015 | 14,849 | ||||
| Routine | 2016 | 13,959 | ||||
| Routine | 2017 | 15,642 | ||||
| Routine | 2018 | 17,300 | ||||
| Routine | 2019 | 17,938 | ||||
| Routine | 2020 | 13,806 | ||||
| Routine | 2021 | 10,722 | ||||
| Routine | 2022 | 16,784 | ||||
| Routine | 2023 | 16,428 | ||||
| Temporary | 2012 | 4,733 | ||||
| Temporary | 2013 | 124 | ||||
| Temporary | 2014 | 139 | ||||
| Temporary | 2015 | 4,890 | ||||
| Temporary | 2016 | 5,105 | ||||
| Temporary | 2017 | 5,467 | ||||
| Temporary | 2018 | 5,388 | ||||
| Temporary | 2019 | 5,059 | ||||
| Temporary | 2020 | 2,920 | ||||
| Temporary | 2021 | 1,094 | ||||
| Temporary | 2022 | 2,606 | ||||
| Temporary | 2023 | 4,410 | ||||
| Other | 2012 | 3,173 | ||||
| Other | 2013 | 2,079 | ||||
| Other | 2014 | 2,085 | ||||
| Other | 2015 | 2,564 | ||||
| Other | 2016 | 2,837 | ||||
| Other | 2017 | 2,882 | ||||
| Other | 2018 | 3,224 | ||||
| Other | 2019 | 3,277 | ||||
| Other | 2020 | 2,687 | ||||
| Other | 2021 | 1,738 | ||||
| Other | 2022 | 2,827 | ||||
| Other | 2023 | 4,114 | ||||
Data Notes
The inspection category labeled "other" includes follow-up, consultation, and complaint investigations.Data Source
Utah Department of Health and Human Services Food Safety ProgramReferences and Community Resources
Voluntary National Retail Food Regulatory Program Standards - August 2022[[br]] [https://www.fda.gov/food/voluntary-national-retail-food-regulatory-program-standards/voluntary-national-retail-food-regulatory-program-standards-august-2022] 2013 FDA Food Code[[br]] [http://www.fda.gov/Food/GuidanceRegulation/RetailFoodProtection/FoodCode/ucm374275.htm] R392-100 Food Service Sanitation Rule[[br]] [https://epi.utah.gov/wp-content/uploads/R392-100_FoodServiceSanitation-1.pdf] Food Safety link - Office of Communicable Disease[[br]] [https://epi.health.utah.gov/food-safety/]More Resources and Links
Evidence-based community health improvement ideas and interventions may be found at the following sites:- Centers for Disease Control and Prevention (CDC) WONDER Database, a system for disseminating public health data and information.
- United States Census Bureau data dashboard.
- Utah healthy Places Index, evidence-based and peer-reviewed tool, supports efforts to prioritize equitable community investments, develop critical programs and policies across the state, and much more.
- County Health Rankings
- Kaiser Family Foundation's StateHealthFacts.org
- Medical literature can be queried at PubMed library.
Page Content Updated On 11/30/2023,
Published on 03/13/2024